Matteo Francia DISI — University of Bologna m.francia@unibo.it
Data understanding
The data understanding phase of CRISP-DM involves taking a closer look at the data available for mining
This step is critical in preventing problems during data preparation, which is typically the longest part of a project
The data understanding phase involves four steps, including:
collection of initial data
description of data
exploration of data, and
verification of data quality
Data collection (or acquisition)
Data collection is the process of gathering information on targeted variables in an established system
Capture evidence that allows data analysis to formulate credible answers to the questions that have been posed
The analyst should make sure to report problems and solutions to aid with future replications of the project.
Data may have to be collected from several different sources, and some of these sources may have a lag time.
The analyst then proceeds to
increase familiarity with the data,
identify data quality problems,
discover initial insights into the data,
detect interesting subsets to form hypotheses about hidden information
Problem: what about biases?
Red dots stand for places where surviving planes were shot. How would you reinforce the planes?
Biases
“If you torture the data long enough, it will confess to anything”
Ronald H. Coase
During data collection and analysis, several biases can occur
Selection: sample used for data collection is not representative of the population being studied
Sampling: certain segments of the population are more likely to be included or excluded from the sample
Response: participants in a survey or study provide inaccurate or misleading responses
Confirmation: refers to the tendency to favor information that confirms pre-existing beliefs or hypotheses while ignoring or discounting contradictory evidence
Cultural: data collection methods, survey questions, or study designs are culturally insensitive or fail to account for cultural differences
Time-Interval: the timing of data collection influences the results
Publication: tendency for researchers or journals to publish studies with positive or significant results while neglecting to publish studies with null or negative results
… and many others
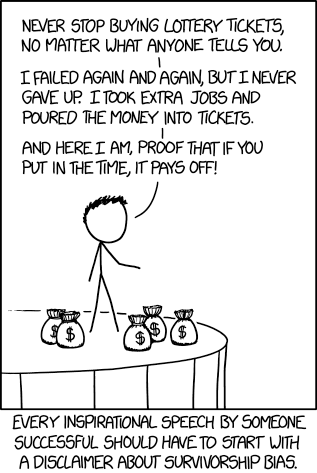
Survivorship bias
The “survivors” get studied, while the failures are excluded, leading to potentially flawed conclusions.
Start-up Success Stories
People often hear stories of wildly successful companies like Apple, Amazon, or Tesla and assume that hard work and a good idea are enough to succeed. This overlooks the countless failed start-ups that had hard-working teams and great ideas but didn’t survive due to market conditions, competition, or other factors.
Fitness and Weight Loss Programs
Testimonials for fitness programs often highlight people who achieved dramatic results. These “success stories” ignore the many individuals who followed the same program but didn’t achieve noticeable results, either due to differences in genetics, lifestyle, or other factors.
Investment Portfolios
Financial advice often highlights top-performing stocks or mutual funds as examples of great investments. These examples focus on the “survivors” in the market, ignoring the many investments that failed or underperformed, which can lead to overestimating the likelihood of similar success in the future.
Survivorship bias
https://xkcd.com/1827/
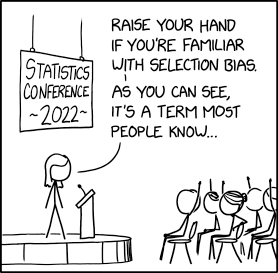
Selection bias
https://xkcd.com/2618/
… and more!
Confirmation Bias
A person who believes in a specific political ideology might seek out news articles or social media posts that reinforce their beliefs, while ignoring or dismissing information that contradicts their views. This selective exposure to information strengthens their pre-existing opinions.
Anchoring Bias
When shopping for a new car, a person may see a car priced at $30,000, and then a second car priced at $25,000. Even if the second car is not objectively better or a great deal, the first price “anchors” their perception of the value of the second car, leading them to think it’s a better deal simply because it’s cheaper than the first option.
Availability Bias
After watching several news reports about airplane crashes, a person might overestimate the risk of flying. They might avoid flying, despite it being statistically safer than driving, because the images and stories of crashes are more readily available in their memory.
Problem: is data the new oil?
The more data we have, the more analysis we can do (however, more data != smarter data)
There are several disciplines focusing on data (e.g., Data Science, Data Mining, Big Data, Business Intelligence)
In Europe (but now in many areas of the world), there can be problems related to privacy
When is it “right” to protect privacy?
When does it become a limit?
Acquiring data is a time-consuming, investment, and knowledge-intensive process
There is no set rule as to the number of variables to include in a prediction model as it often depends on several factors. The ‘one in ten rule’, a rule that stipulates how many variables/parameters can be estimated from a data set, is quite popular in traditional clinical prediction modeling strategies (e.g., logistic regression and survival models). According to this rule, one variable can be considered in a model for every 10 events
Problem: how can we collect data?
Public Datasets
We can get data mainly in two ways:
By using publicly available data (datasets or databases) → someone collected them for us!
They can be free or for a fee
The quality of the data made available must be checked
By acquiring a new set of data, but why?
It is not certain that public data well represent the problem we want to solve
We want to acquire specific data and thus generate specific expertise for the company (know-how)
We are forced to acquire data that due to their sensitive nature would not otherwise be available (privacy issues)
The company we work for already has a data collection process that we can use
Many universities publicly release their datasets:
There are no requirements related to profit or non-disclosure agreement (NDA)
It is the basis of the scientific method, in particular for the reproducibility of the results obtained
I release my data so that others can conduct my own experiments and verify my results
Pedestrian Detection → data: images, label: presence of a pedestrian (yes/no)
Pedestrian Localization → data: images, label: position of the pedestrian (x, y, w, h)
Audio classification numbers → data: audio sequences, label: number (‘five’)
Data collected without correct and timely annotation is often useless
However, it is also possible to “extract knowledge” from un-annotated data through, for instance, clustering
Data Annotation Process
The data annotation process can take place in several ways:
Manual: each data is manually annotated
A long and expensive process
The quality of the annotations is usually controllable and high
This is not always an applicable process (for example, is it possible to annotate a dataset with 1M of images?)
Automatic: each data is automatically annotated, using specific tools
It is based on particular a priori knowledge (for example, all images acquired in a dog shelter depict dogs).
The quality of the annotations is not always easily controlled
Third parties: all data is noted by a third party
Free of charge: this is the case, for example, in which users barter the free use of some platform with the transfer of their annotated data (for example, photos uploaded - to Facebook accompanied by information regarding the content, the position of the face, or scene acquired).
Paid: there are platforms where it is possible to purchase annotation time from third parties (often from “developing countries”). Example: Amazon Mechanical Turk
Batini, Carlo, Cinzia Cappiello, Chiara Francalanci, and Andrea Maurino. 2009. “Methodologies for Data Quality Assessment and Improvement.”ACM Computing Surveys (CSUR) 41 (3): 1–52.
Chowdhury, Mohammad Ziaul Islam, and Tanvir C Turin. 2020. “Variable Selection Strategies and Its Importance in Clinical Prediction Modelling.”Family Medicine and Community Health 8 (1).
Fisher, Ronald A. 1936. “The Use of Multiple Measurements in Taxonomic Problems.”Annals of Eugenics 7 (2): 179–88.
Sidi, Fatimah, Payam Hassany Shariat Panahy, Lilly Suriani Affendey, Marzanah A Jabar, Hamidah Ibrahim, and Aida Mustapha. 2012. “Data Quality: A Survey of Data Quality Dimensions.” In 2012 International Conference on Information Retrieval & Knowledge Management, 300–304. IEEE.

 Problem: what about biases?