Matteo Francia DISI — University of Bologna m.francia@unibo.it
How did we get here?
Data-Driven Innovation
Use of data and analytics to foster new products, processes, and markets
Drive discovery and execution of innovation, achieving new services with a business value
Analytics
A catch-all term for different business intelligence (BI) and application-related initiatives
E.g., analyzing information from a particular domain
E.g., applying BI capabilities to a specific content area (e.g., sales, service, supply chain)
Advanced Analytics
(Semi-)Autonomous examination of data to discover deeper insights, make predictions, or generate recommendations (e.g., through data/text mining and machine learning)
Augmented Analytics
Use of technologies such as machine learning and AI to assist with data preparation, insight generation, and insight explanation to augment how people explore and analyze data
Companies are collecting tons of data to enable advanced analytics.
Raw data is difficult to obtain, interpret, and maintain
Data is more and more heterogeneous
There is a need for curating data to make it consumable
Where are we collecting/processing data?
Getting value from data is not (only) a matter of storage
Need integrated and multilevel analytical skills and techniques
Data platform
“It is a capital mistake to theorize before one has data. Insensibly, one begins to twist the facts to suit theories, instead of theories to suit facts.”
– Sherlock Holmes
Getting value from data is not (only) a matter of storage
Any example?
Case study: photo gallery
Photo Gallery
Google photos
Google photos
Introduction
Managing large photo collections is increasingly challenging.
Common issues include:
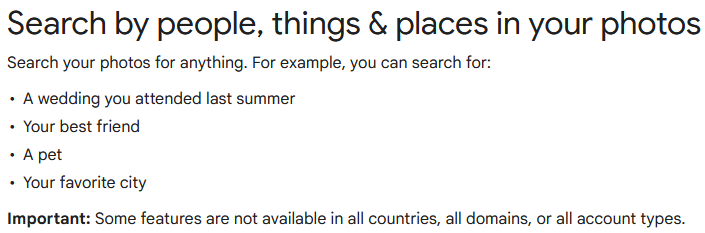
Difficulty searching and organizing images
Loss of contextual information about each photo
Time-consuming manual tagging and categorization
Challenges in Photo Gallery Management
Thousands of images accumulate over time
Manual metadata entry is slow and error-prone
Finding images based on content is difficult
Metadata inconsistency leads to poor searchability
Why Metadata Matters
Metadata provides critical information about images:
File-level info: name, size, creation date
Camera info: make, model, GPS, exposure
Content info: objects, people, and scenes
Well-structured metadata enables:
Fast search and filtering
Smarter organization and categorization
Enhanced user experience
Using YOLO for Metadata Extraction
YOLO (You Only Look Once) is a state-of-the-art object detection system.
Automatically detects objects in images
Provides labels, bounding boxes, and confidence scores
Converts visual content into structured metadata
How YOLO Sees the Image
Input image is divided into a grid (e.g., 13x13)
Each grid cell is responsible for objects whose center falls in the cell
Each cell predicts bounding boxes + confidence + class probabilities
What Each Cell Predicts
For each bounding box:
Coordinates: (x, y, width, height)
Confidence: probability an object exists × IoU with ground truth
Class probabilities: likelihood of each object class
“A database is a structured and persistent collection of information about some aspect of the real world, organized and stored in a way that facilitates efficient retrieval and modification. The structure of a database is determined by an abstract data model. Primarily, it is this structure that differentiates a database from a data file.”
Relational database
Data platform
At the beginning, computer science was seen as a subsidiary discipline that makes information management faster and cheaper
… but did not create (new) profits in itself
The main goal of databases in companies has been that of storing operational data(Codd 1970)
Data generated by operations carried out within business processes
Online transaction processing (OLTP) is a type of database system used in transaction-oriented applications, such as many operational systems.
“Online” refers to the fact that such systems are expected to respond to user requests and process them in real-time.
Large number of database transactions (writing and reading data) in real-time
Data platform
An exponential increase in operational data has made computers the only tools suitable for decision-making performed by business users
The massive use of techniques for analyzing enterprise data made information systems a key factor to achieve business goals
The role of computer science in companies has radically changed since the early 70’s.
ICT systems turned from simple tools to improve process efficiency…
… into key factors of company organizations capable of deeply impacting on the structure of business processes
Problem: how do we manage data heterogeneity?
Data platform
Schemaless databases
There is no predefined schema that the data must conform to before being added to the database. As a result, you don’t need to know the structure of your data, enabling you to store all your data more easily and quickly.
NoSQL
Problem: how do we transform data into actionable business insights?
Data platform
Big Data must be transformed into Small Data so that it can be exploited for decision-making purposes
Small data is data that is “small” enough for human comprehension.
It is data in a volume and format that makes it accessible, informative and actionable.
Big vs small data
Data platform
Scenario:
Large company, with several branches
Managers wish to quantify and evaluate the contribution given from each branch to the global profit
“A collection of data that supports decision-making processes. It provides the following features: subject-oriented, integrated and consistent, not volatile.”
DWH
Data platform
A DWH is a collection of data that supports decision-making processes. It provides the following features:
It is subject-oriented;
It is integrated and consistent;
It shows its evolution over time and it is not volatile
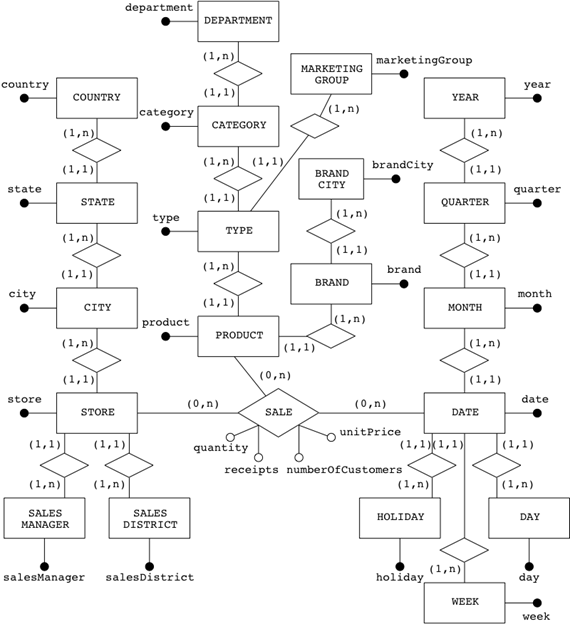
The multidimensional model is the key for representing and querying information in a DW
(Business) Facts of interest are represented in (hyper) cubes where:
Each cell stores numerical measures that quantify the fact from different points of view;
Each axis is a dimension for analyzing measure values;
Each dimension can be the root of a hierarchy of attributes used to aggregated measure values
Online analytical processing (OLAP) to answer multi-dimensional analytical queries.
Interactive sessions of analysis reading large amounts of data.
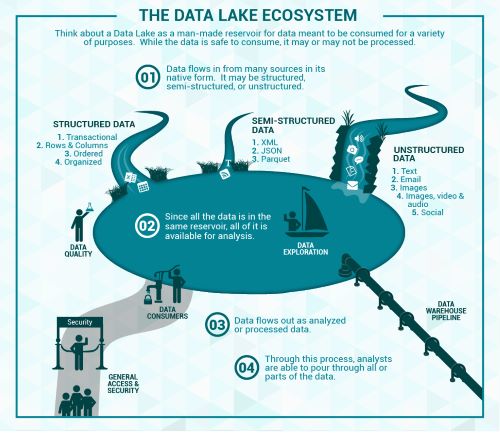
“A DL is a central repository system for storage, processing, and analysis of raw data, in which the data is kept in its original format and is processed to be queried only when needed. It can store a varied amount of formats in big data ecosystems, from unstructured, semi-structured, to structured data sources.”
Data lake
Data platform
Data lake
Data platform
The data lake started with the Apache Hadoop movement, using the Hadoop File System (HDFS) for cheap storage
Schema-on-read architecture
Agility of storing any data at low cost
Eludes the problems of quality and governance
Downsides of data lakes
Security
All the data is stored and managed as files
No fine-grained access control on the contents of files, but only coarse-grained access governing who can access what files or directories
Quality
Hard to prevent data corruption and manage schema changes
Challenging to ensure atomic operations when writing a group of files
No roll-back mechanism
Query performance
Formats are not optimized for fast access
It is often said that the lake easily turns into a swamp
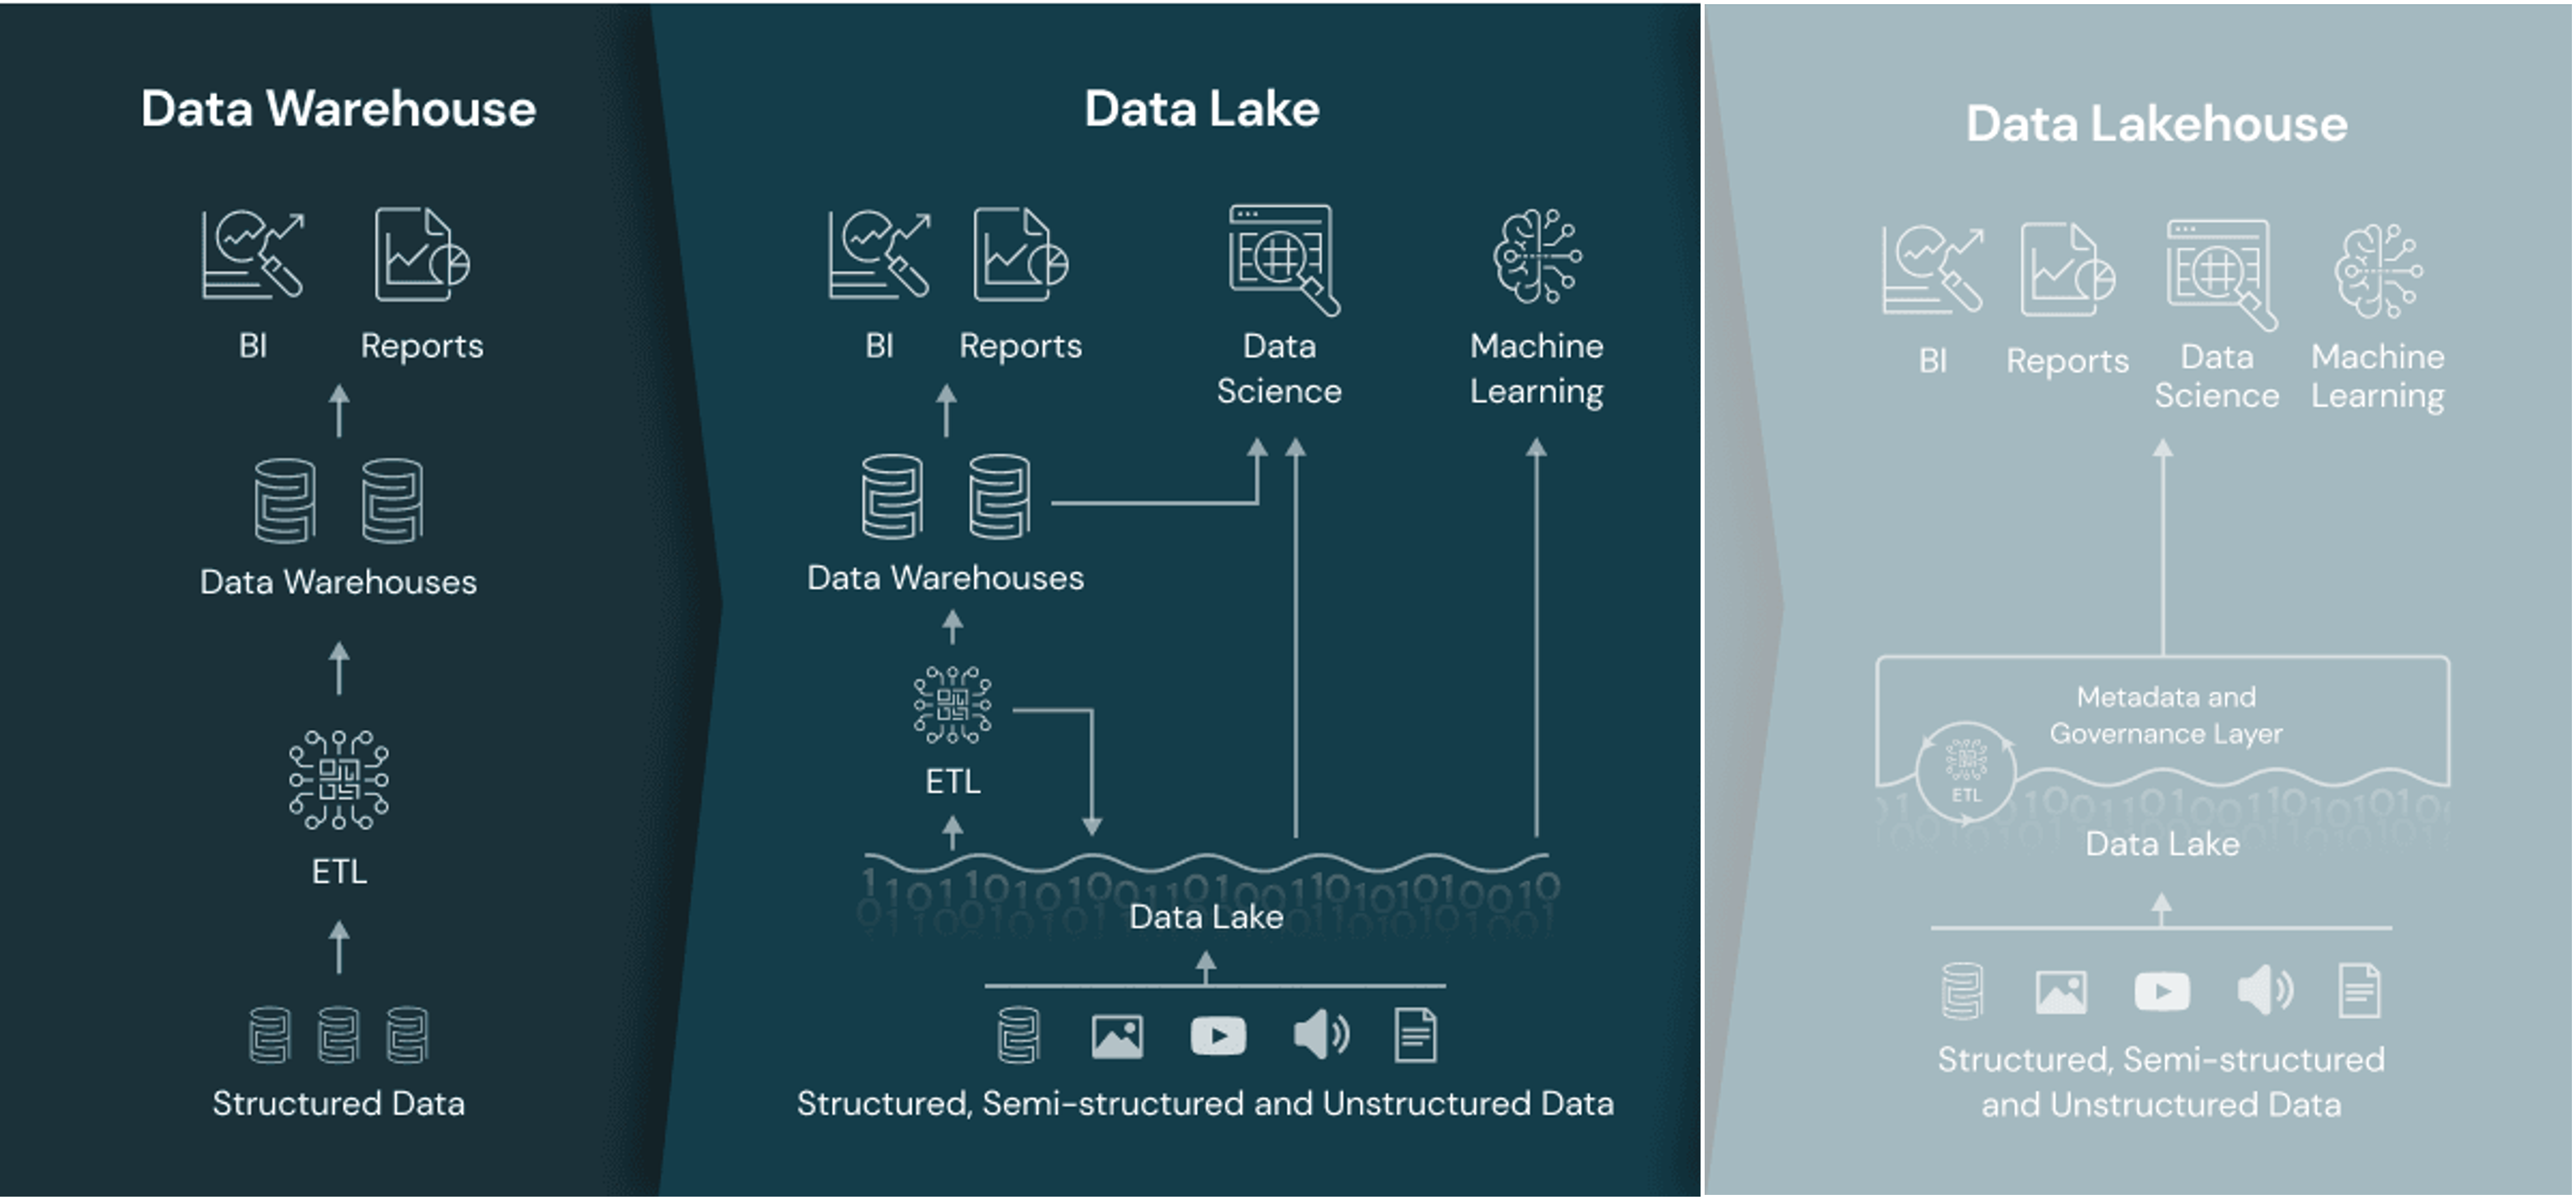
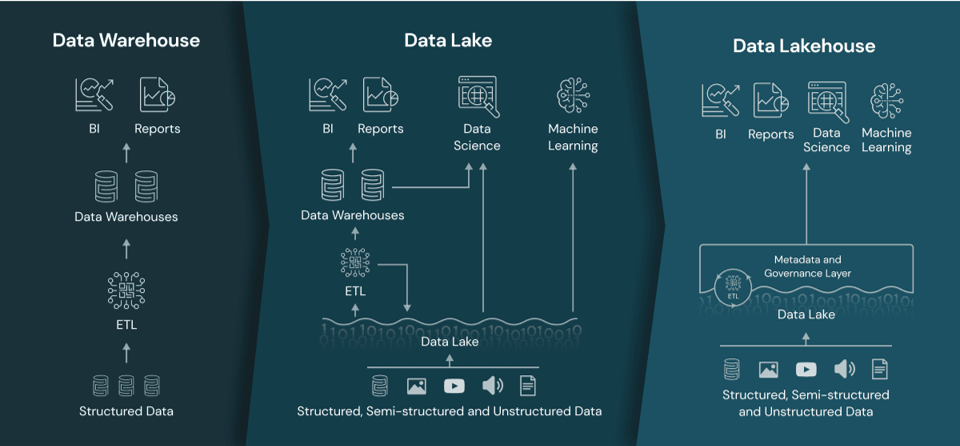
DWH vs Data Lake?
Data platform: DWH vs Data Lake
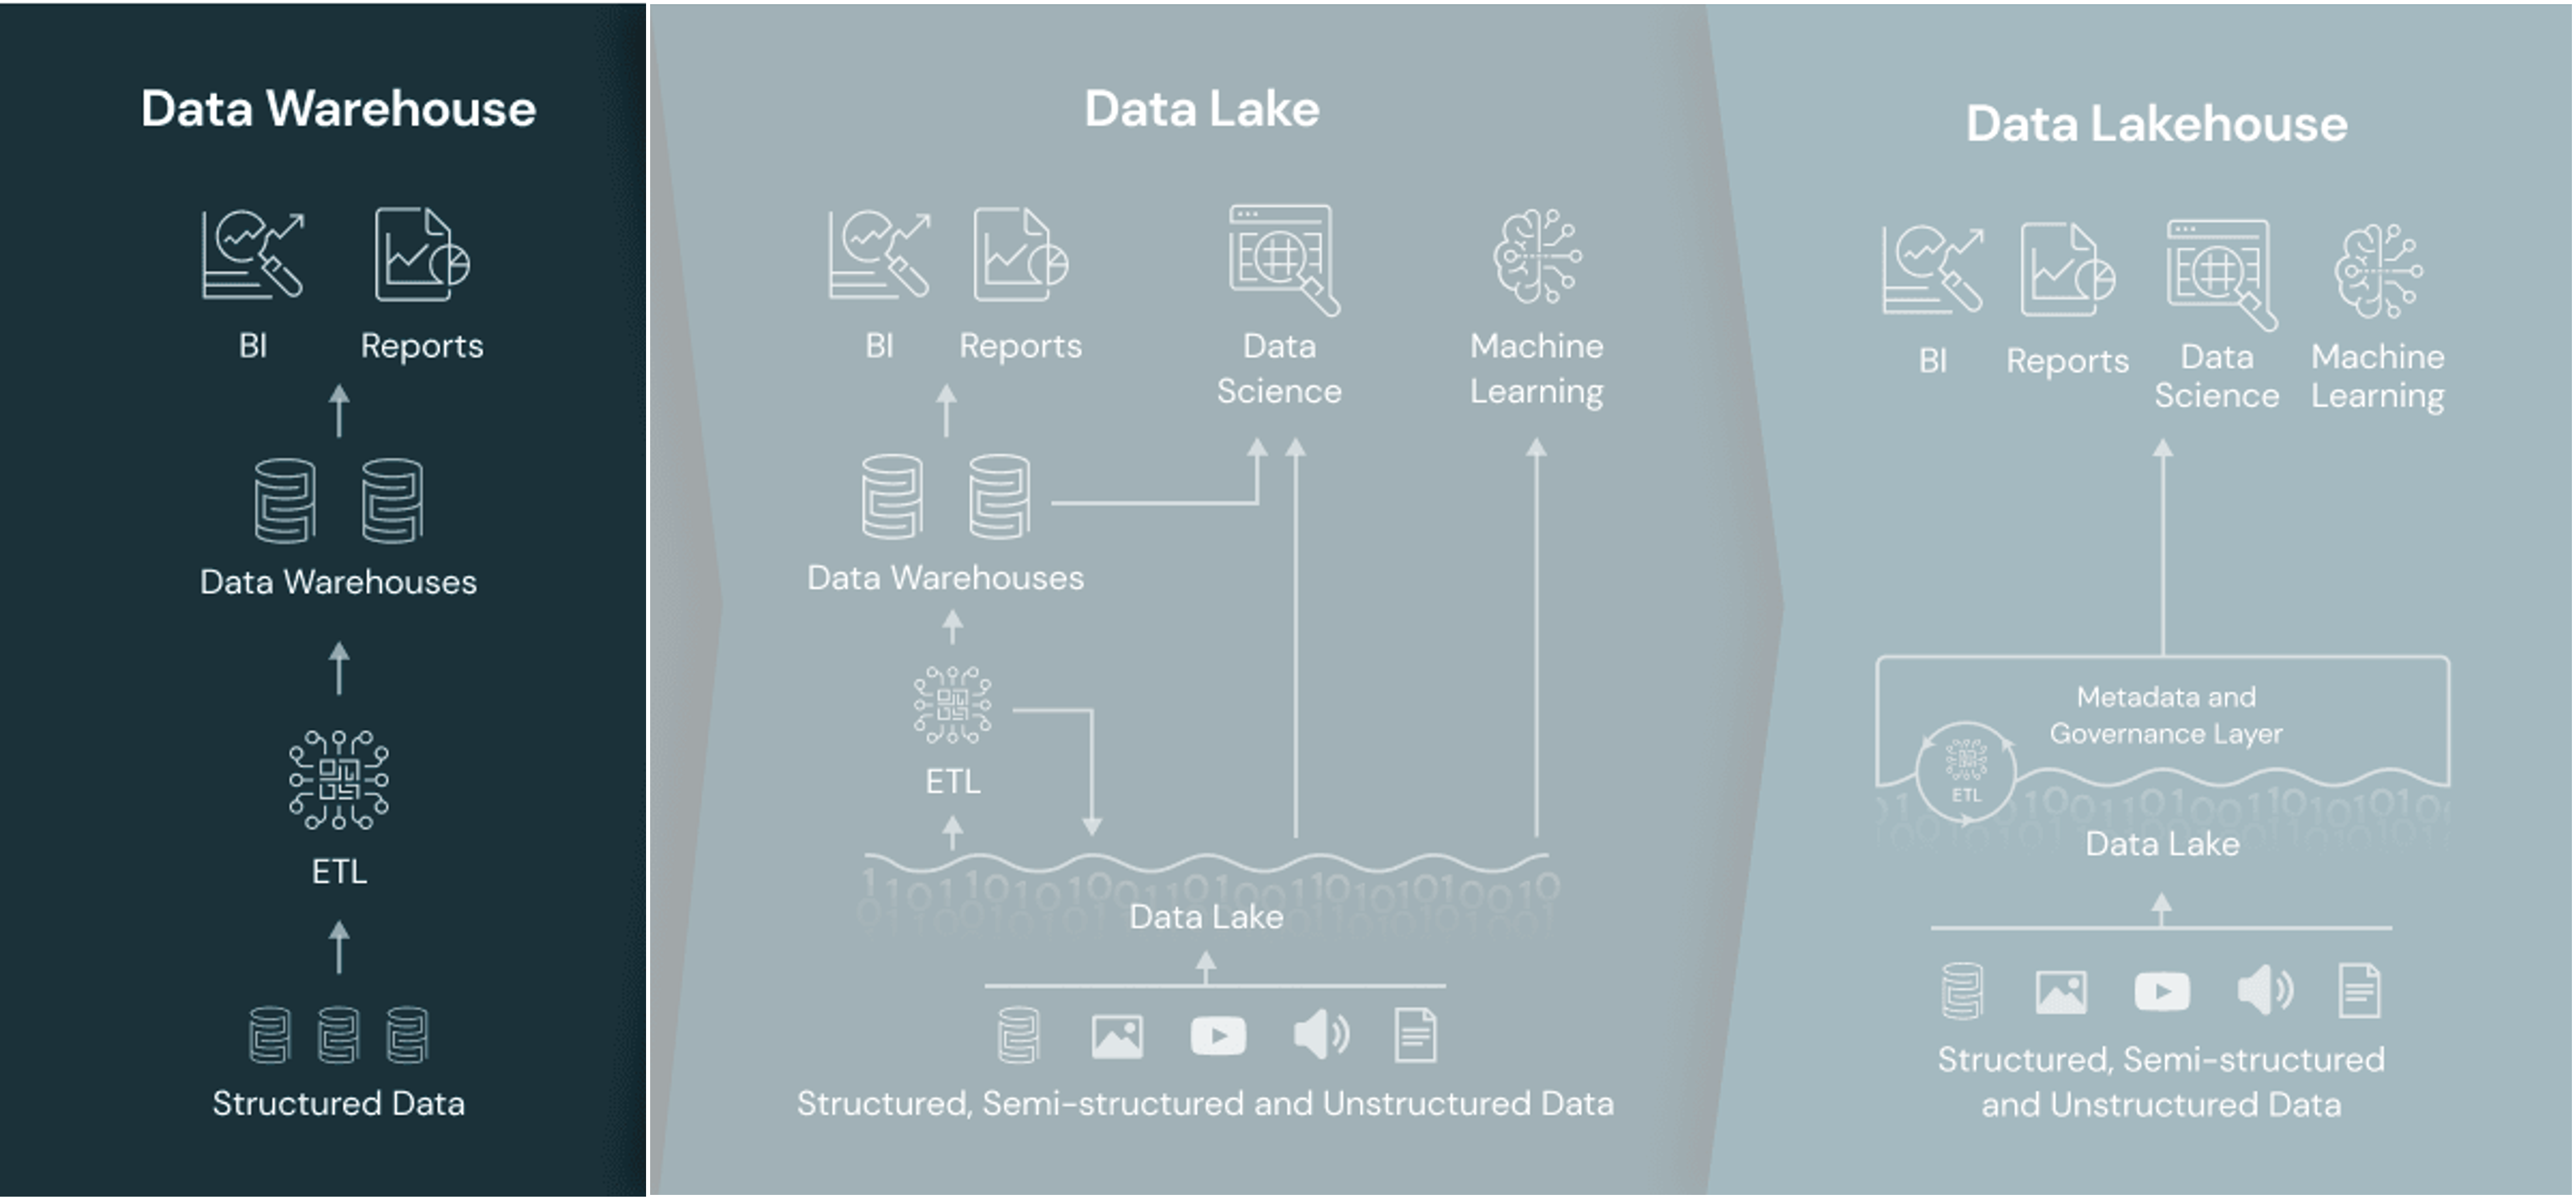
Data warehouse
Data lake
Data model
Relational
Non-relational and relational
Schema
Designed prior to implementation (schema-on-write)
Written at the time of analysis (schema-on-read)
Price/performance
Faster queries, higher cost storage
Slower queries, lower-cost storage
Data quality
Highly curated data, the central version of the truth
Any (raw) data
Users
Business analysts
Data scientists, developers, and business analysts
Analytics
Batch reporting, BI, and visualizations
Machine learning, predictive analytics, data discovery, and profiling.
Data platform
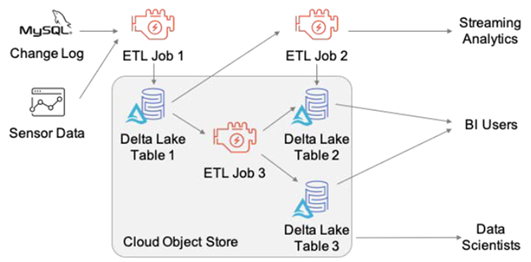
A two-tier data lake + DWH architecture is dominant in the industry
HDFS replaced by cloud data lakes (e.g., S3, ADLS, GCS)
Data lake directly accessible to a wide range of analytics engines
A subset of data is “ETL-ed” to a DWH for important decision support and BI apps
While the data lake and DWH architecture is ostensibly cheap, a two-tier architecture is highly complex for users
Problems?
Data platform
(Some) main problems:
Data is first ELTed into lakes, and then again ETLed into DWHs
Reliability. Keeping the data lake and DWH consistent is difficult and costly
Data staleness. The data in the DWH is stale compared to that of the data lake, with new data frequently taking days to load
Limited support for advanced analytics.
Businesses want to ask predictive questions using their DWHs
Machine learning systems does not work well on (directly) top of DWHs
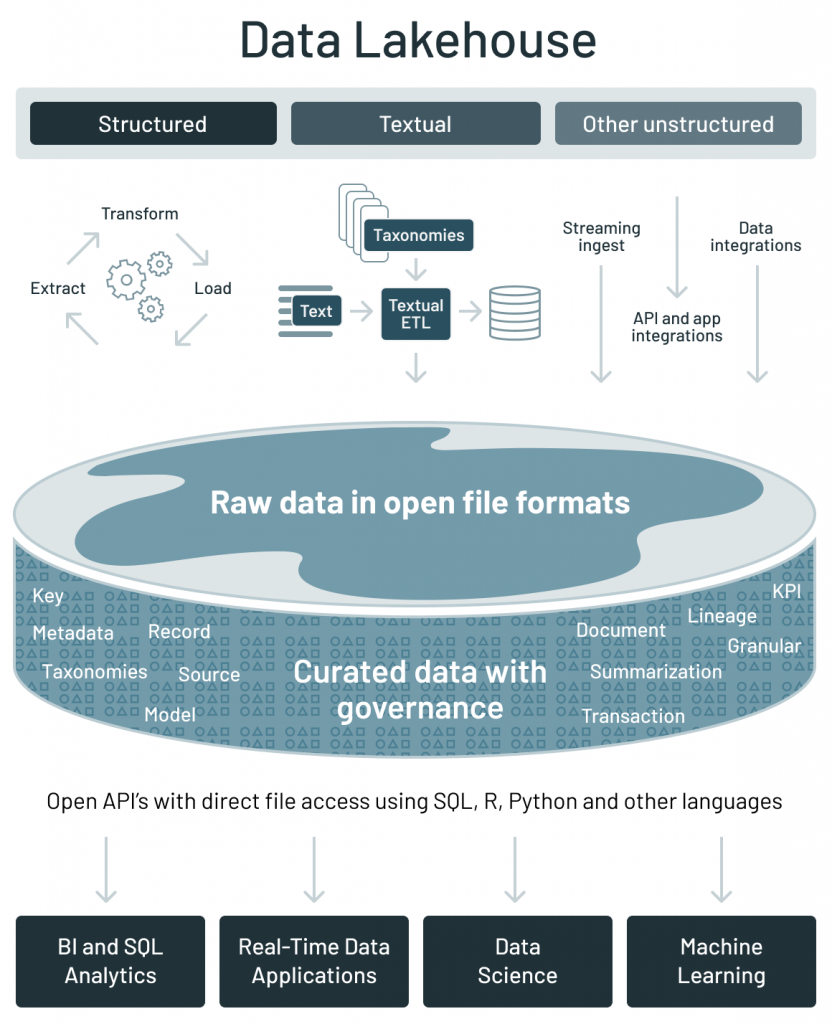
Data management architecture that combines the flexibility, cost-efficiency, and scale of data lakes with the data management and ACID transactions of DWHs, enabling business intelligence (BI) and machine learning (ML) on all data
Key technologies used to implement Data Lakehouses
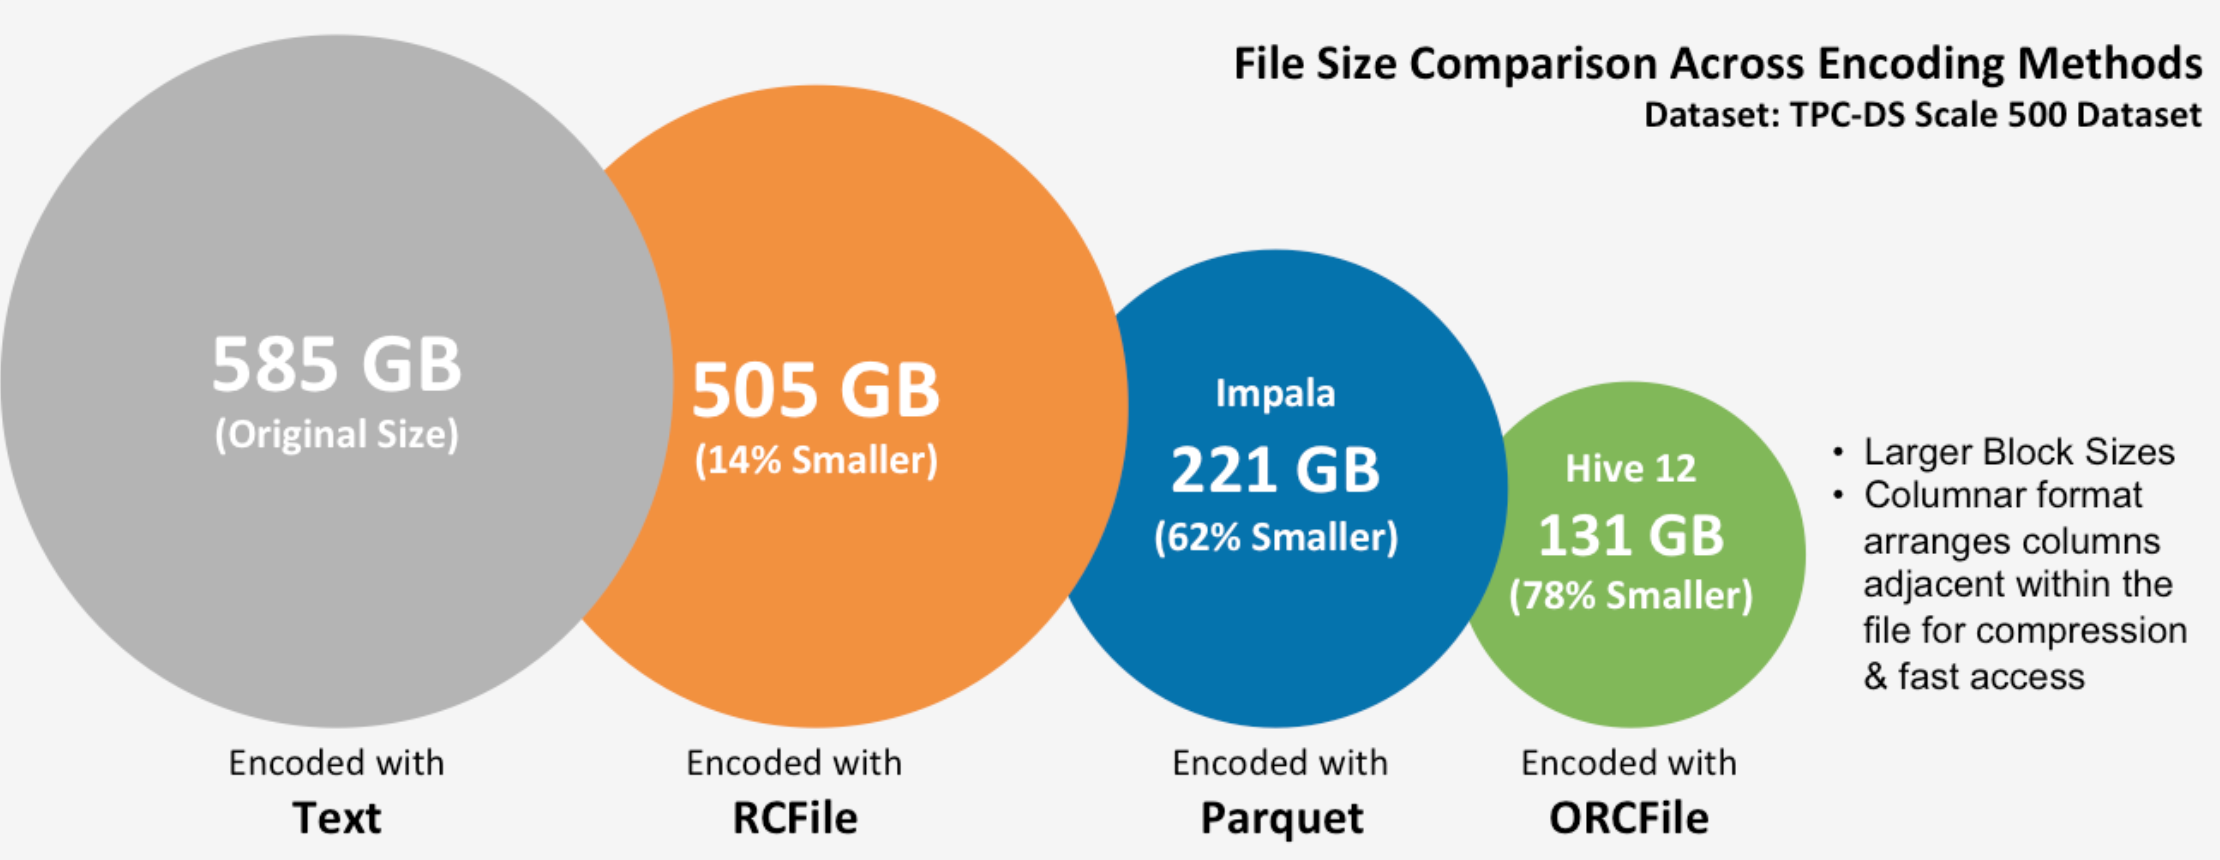
Store data in a low-cost object store using a standard file format such as Apache Parquet
Implement a transactional metadata layer on top of the object store that defines which objects are part of a table version
Implement management features within the metadata layer
Challenges:
The metadata layer is insufficient to achieve good SQL performance
DWHs use several techniques to get state-of-the-art performance
Storing hot data on fast devices such as SSDs, maintaining statistics, building efficient indexes, etc.
In a Lakehouse it is not possible to change the format, but it is possible to implement other optimizations that leave the data files unchanged
Data lakehouse
Challenges:
Most data lakes (e.g., cloud object stores) are simple key-value stores without cross-key consistency.
Multi-object updates aren’t atomic, and there’s no isolation between queries.
Queries updating multiple objects can expose readers to partial updates as each object is written individually.
For large tables with millions of objects, metadata operations are costly.
The latency of cloud object stores can make data-skipping checks slower than the query itself.
Delta Lake uses a transaction log compacted into Apache Parquet for much faster metadata operations on large tabular datasets.
The log resides in the _delta_log subdirectory.
It contains:
JSON objects with sequential IDs for log records (i.e., commits)
Periodic checkpoints summarizing the log up to that point
Delta lake
Data lakehouse
Data Warehouse
Data Lake
Data Lakehouse
Data format
Proprietary format
Open format
Open format
Types of data
Structured, limited semi-structured
*
*
Data access
SQL-only, no file access
File access
APIs for SQL, R, Python, etc.
Reliability
High quality, ACID transactions
Low quality, “data swamp”
High quality, ACID transactions
Governance & security
Fine-grained (row/column-level)
Weak governance; file-level security
Fine-grained (row/column-level)
Performance
High
Low
High
Scalability
Expensive at scale
Scales cheaply for any data type
Scales cheaply for any data type
Use case
BI
Machine learning
Unified for BI and ML
Data platform
Data lakes (or lakehouses) have increasingly taken the role of data hubs
Eliminate up-front costs of ingestion and ETL since data are stored in the original format
Once in DL, data are available for analysis by everyone in the organization
Drawing a sharp line between storage/computation/analysis is hard
Is a database just storage?
What about SQL/OLAP?
Blurring of the architectural borderlines
DL is often replaced by “data platform” or “data ecosystem”
Encompass systems supporting data-intensive storage, computation, analysis
Data platform
Data platform
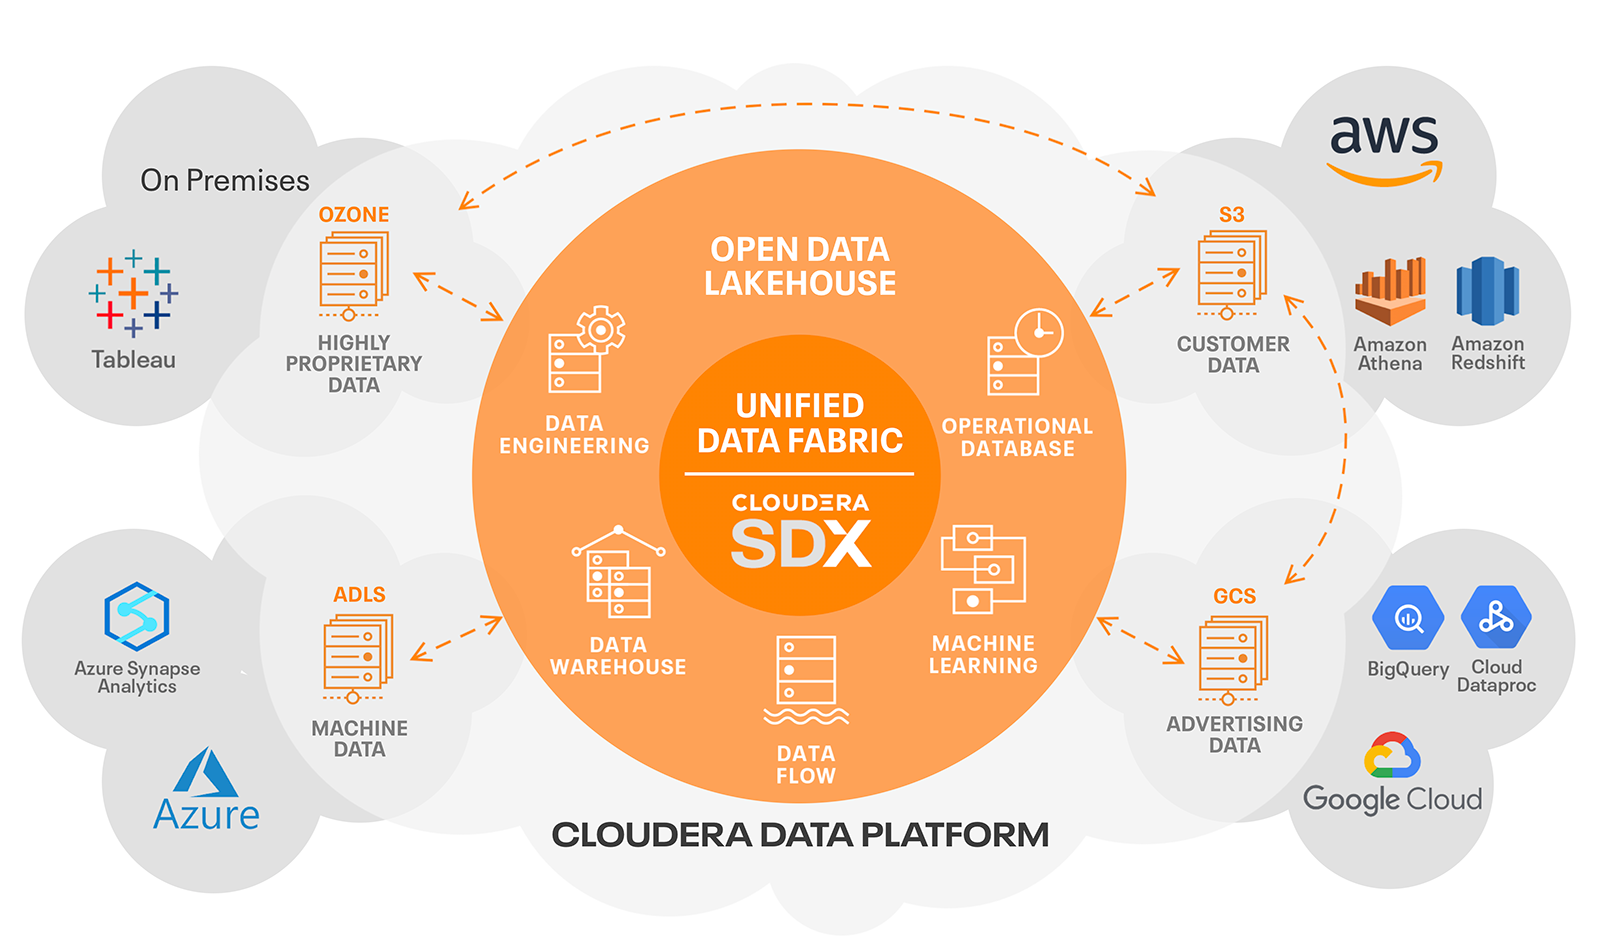
A unified infrastructure that facilitates the ingestion, storage, management, and exploitation of large volumes of heterogeneous data. It provides a collection of independent and well-integrated services meeting end-to-end data needs.
Unified: is conceptually a data backbone
Independent: a service is not coupled with any other
Well-integrated: services have interfaces that enable easy and frictionless composition
End-to-end: services cover the entire data life cycle
Rationale: relieve users from the complexity of administration and provision
Not only technological skills, but also privacy, access control, etc.
Users should only focus on functional aspects
Data platform
Are we done? No!
Lacking smart support to govern the complexity of data and transformations
Data transformations must be governed to prevent DP from turning into a swamp
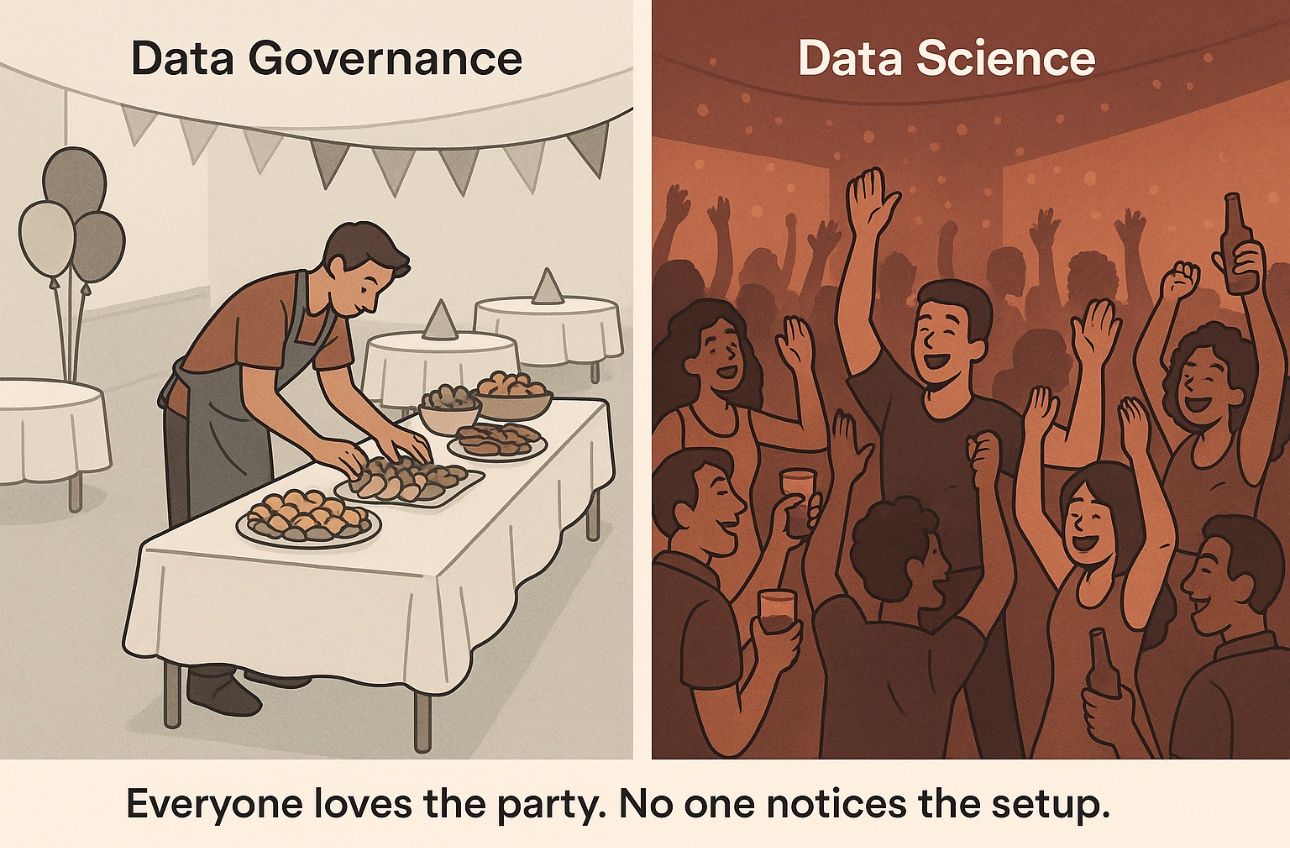
Amplified in data science, with data scientists prevailing over data architects
Leverage descriptive metadata and maintenance to keep control over data
Which functionalities for (automated) data management can you think about?
Data governance
Managing data platforms
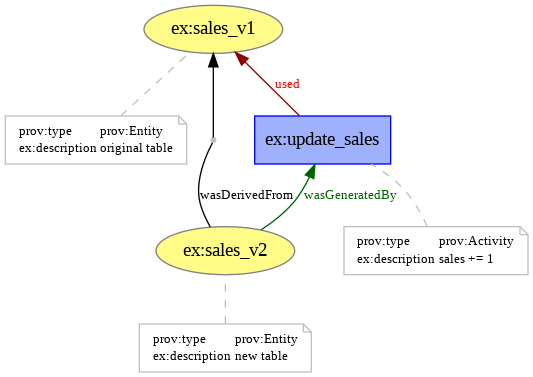
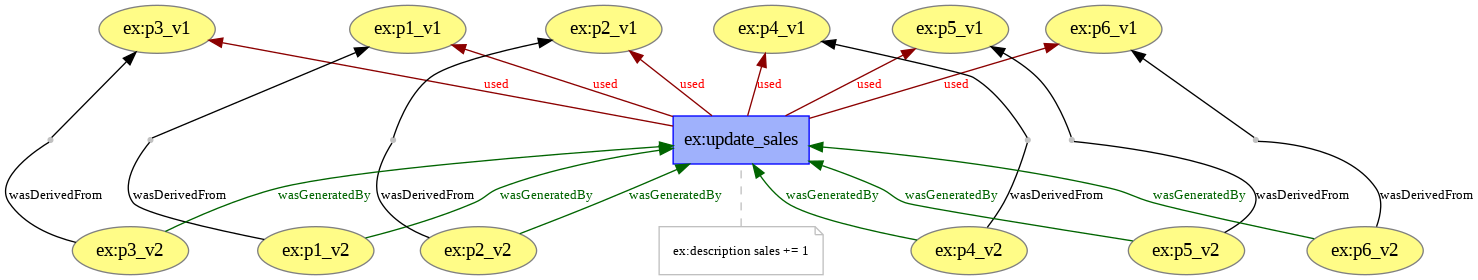
Tracking data pipelines: Data provenance
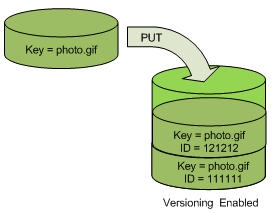
Tracking changes: Data versioning
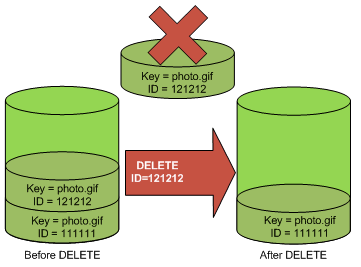
Saving storage: Compression
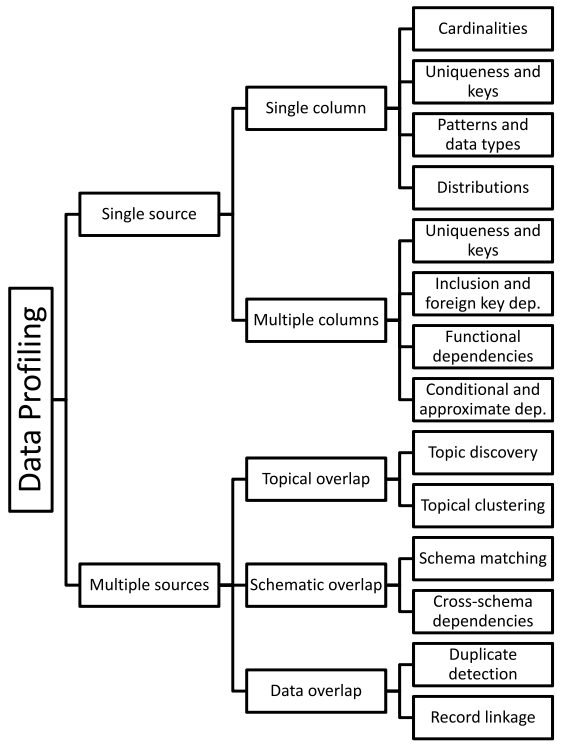
Understanding the data: Data profiling
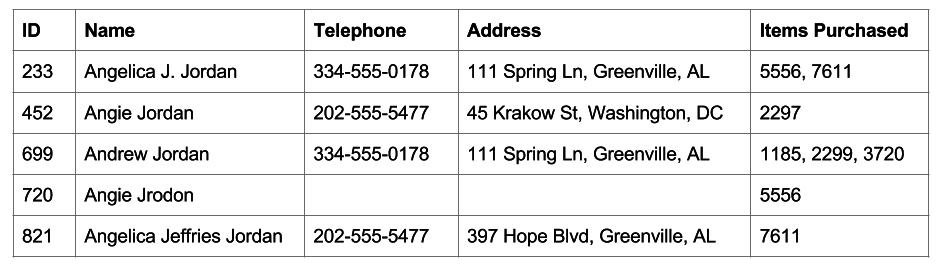
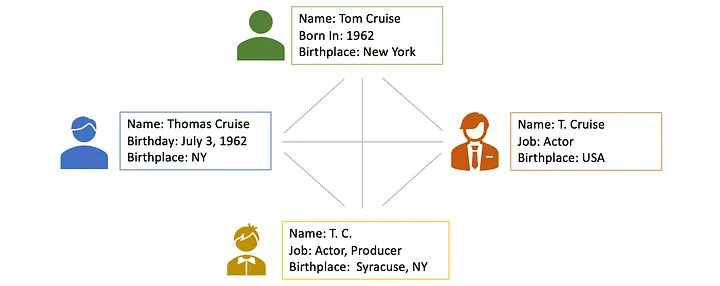
Integrating data sources: Entity resolution
…
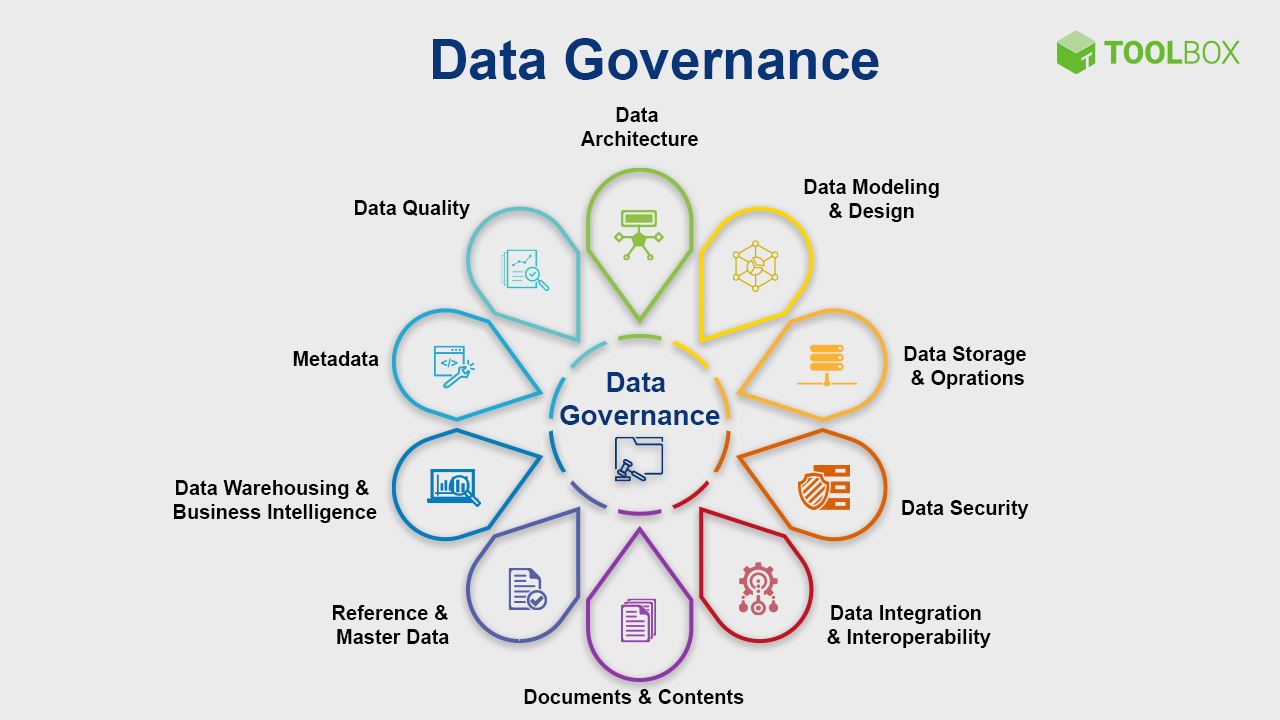
Data governance
Data governance
Techniques to ensure that data is secure, private, accurate, available, and usable
It includes the actions people must take, the processes they must follow, and the technology that supports them throughout the data life cycle
Every organization needs data governance since industries proceed on their digital-transformation journeys
A data steward is a role that ensures that data governance processes are followed and that guidelines are enforced, and recommends improvements to data governance processes.
Data governance
Case study: data governance
Problem: how can we manage a datalake?
Context:
You are working for a consultancy company specialized in data engineering.
This is a typical use cases of internships or thesis projects in DTM or ISI.
Your client is a large enterprise that has accumulated massive amounts of heterogeneous data across departments.
Objectives: assess and organize the data lake to produce unified data assets ready for downstream analytics.
Brainstorming: which problems do you see?
Brainstorming: problems
Data lakes collect data from different sources (e.g., departments)
Files may have:
Different formats (CSV, Excel, JSON)
Different schemas (column names vary)
Duplicated or overlapping concepts
A (table) schema is the blueprint or structure that defines how data is organized (within a table), specifying the names, data types, and constraints (for each column).
Users need to find and integrate relevant data but they don’t know:
A broad range of methods to efficiently analyze a given data set
E.g., in a relational scenario, tables of a relational database are scanned to derive metadata, such as data types, completeness and uniqueness of columns, keys and foreign keys, and occasionally functional dependencies and association rules
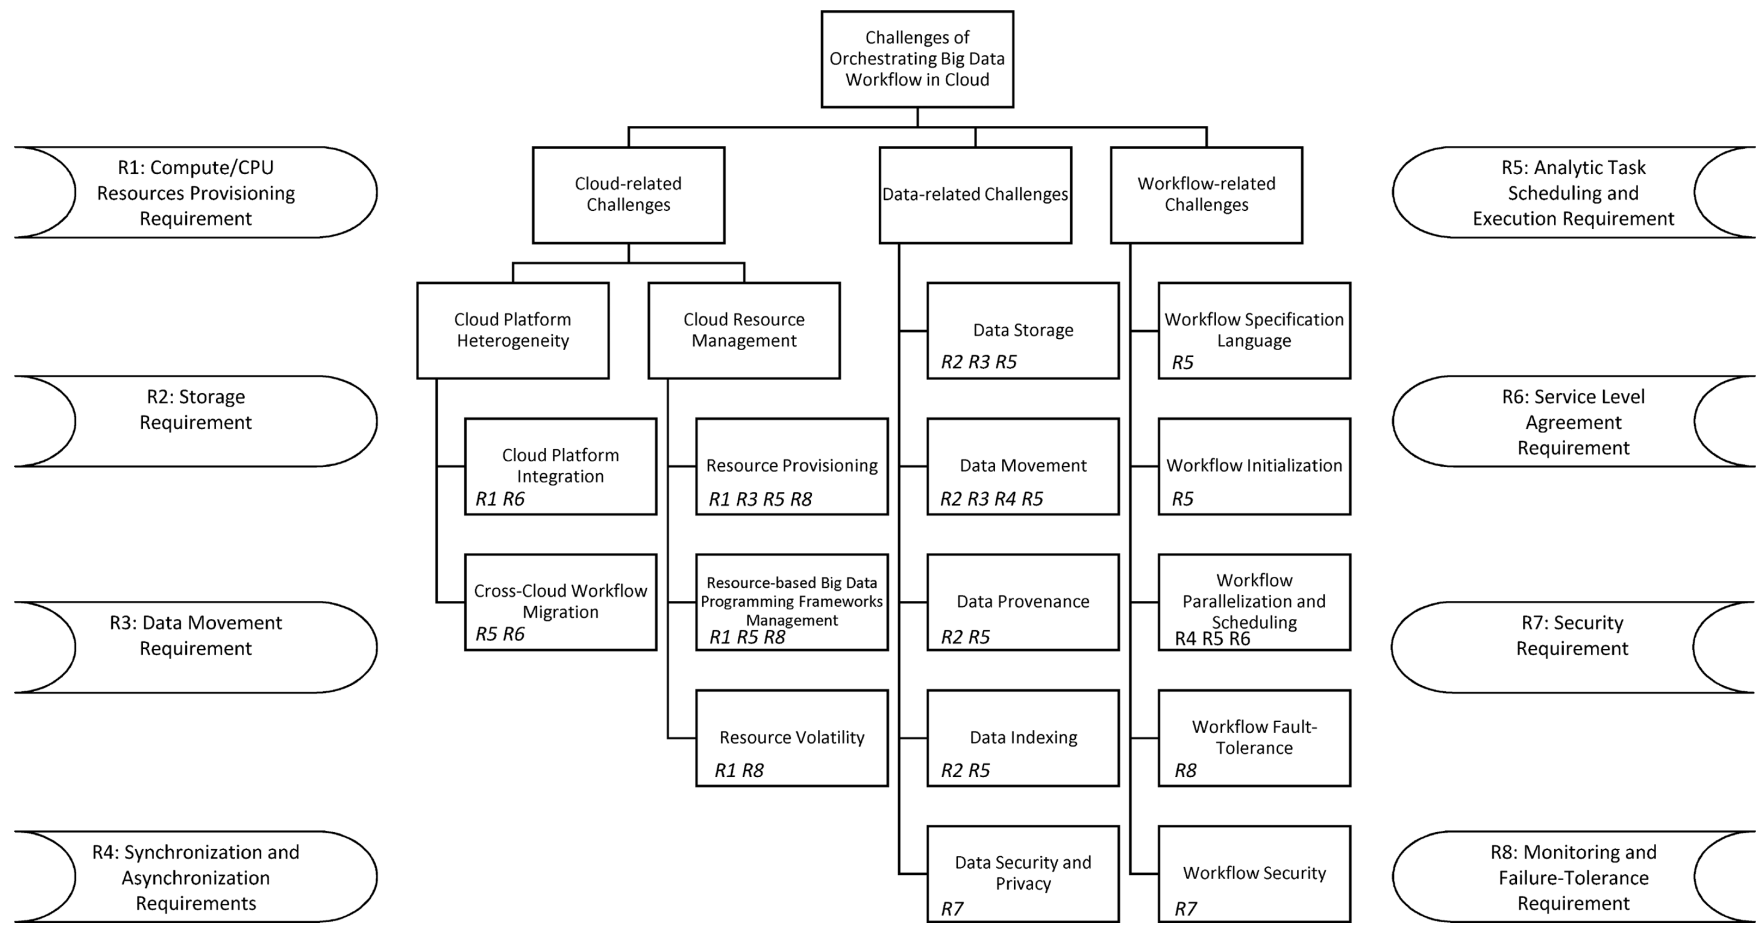
Coordinate workflows across diverse big data models
Track and capture data provenance
R6 Service Level Agreement
Meet user-defined QoS, such as strict deadlines
R7 Security
Support anonymous computation, verify outcomes in multi-party settings, etc.
R8 Monitoring and Failure-Tolerance
Ensure streamlined execution
Handle or predict failures as they occur
Data mesh
Distributed data architecture under centralized governance for interoperability, enabled by a shared and harmonized self-serve data infrastructure
Domain-oriented decentralized data ownership
Decentralization and distribution of responsibility to people who are closest to the data, to support continuous change and scalability
Each domain exposes its own operational/analytical APIs
Data as a product (quantum)
Products must be discoverable, addressable, trustworthy, self-describing, and secure
Self-serve data infrastructure as a platform
High-level abstraction of infrastructure to provision and manage the lifecycle of data products
Federated computational governance
A governance model that embraces decentralization and domain self-sovereignty, interoperability through global standardization, a dynamic topology, and automated execution of decisions by the platform
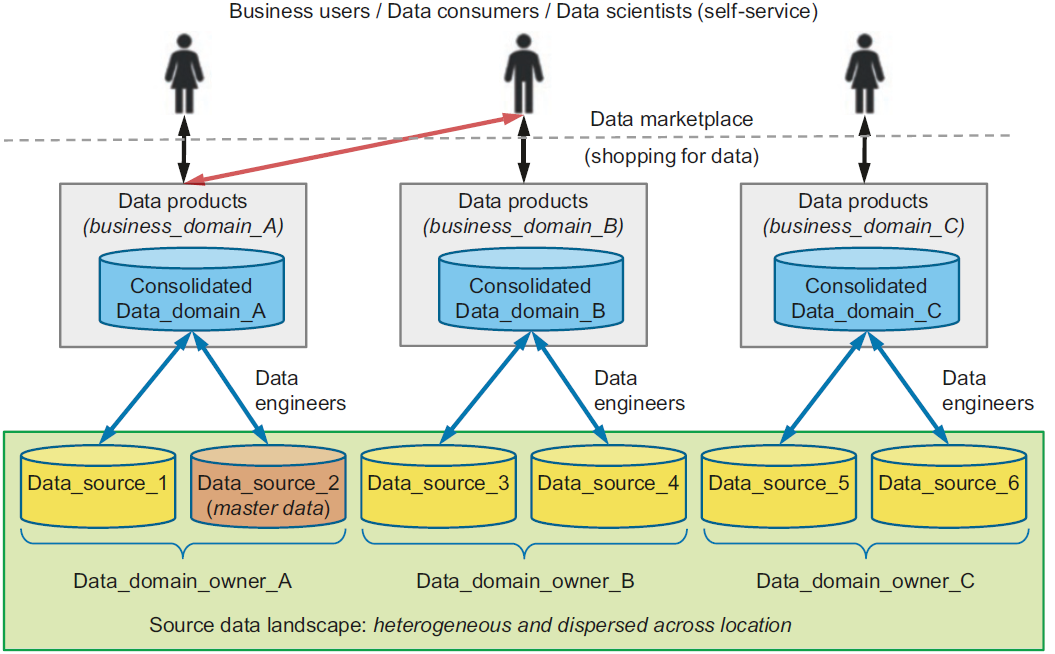
Data Mesh organizes data around business domain owners and transforms relevant data assets (data sources) to data products that can be consumed by distributed business users from various business domains or functions.
Data products are created, governed, and used in an autonomous, decentralized, and self-service manner
Self-service capabilities, which we have already referenced as a Data Fabric capability, enable business organizations to entertain a data marketplace with shopping-for-data characteristics
Data mesh
What makes data a product?
A data product is raw data transformed into a business context
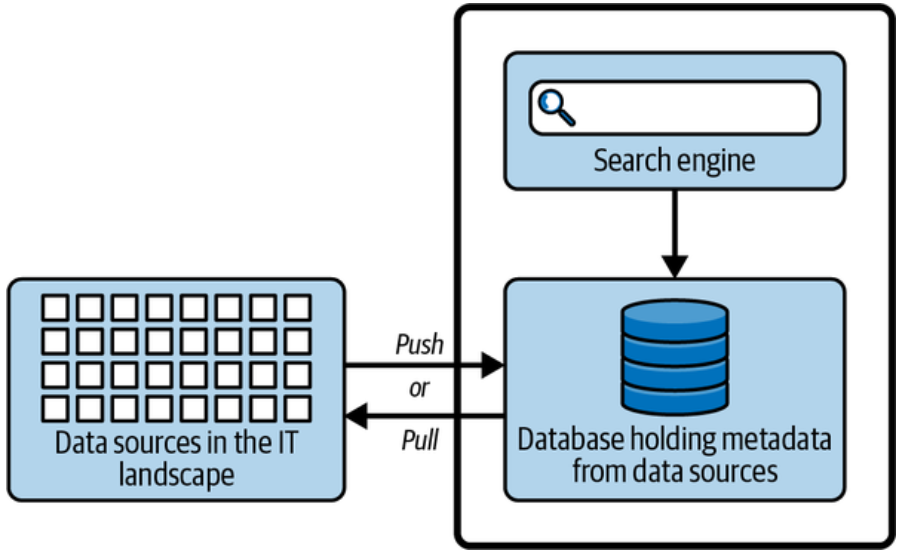
Data products are registered in the knowledge catalog through specifications (XML, JSON, etc.).
Data products need to be searchable and discoverable by potential data product consumers and business users.
Cataloged: All data products need to be registered in the knowledge catalog.
Data product description: The data product needs to be well-described.
Access methods: for example, REST APIs, SQL, NoSQL, etc., and where to find the data asset.
Policies and rules: who is allowed to consume the data product for what purpose.
SLAs: agreements regarding the data product availability, performance characteristics, functions, and cost of data product usage.
Data products themselves are not stored in the knowledge catalog
Case study: data mesh
Check the seminars from HERA.
End of the case study
Data mesh vs data fabric
They are design concepts, not things.
They are not mutually exclusive
They are architectural frameworks, not architectures
The frameworks must be adapted and customized to your needs, data, processes, and terminology
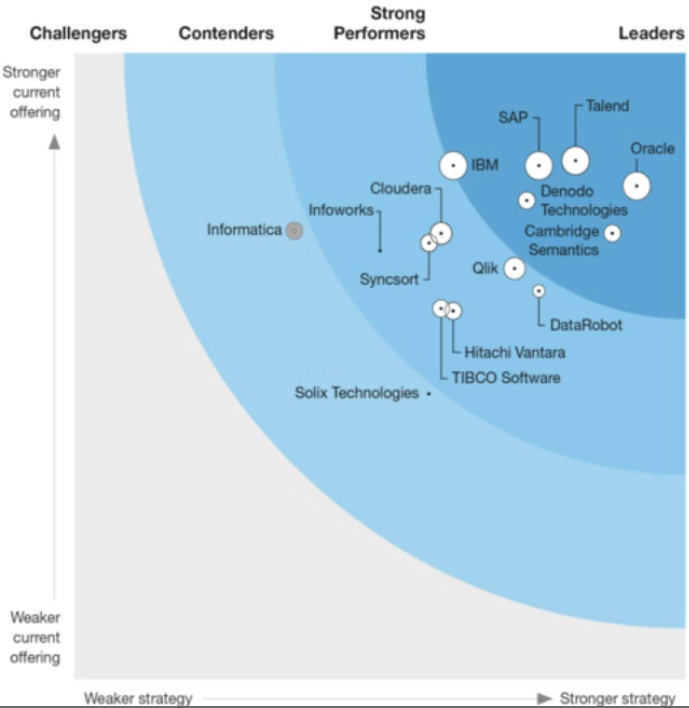
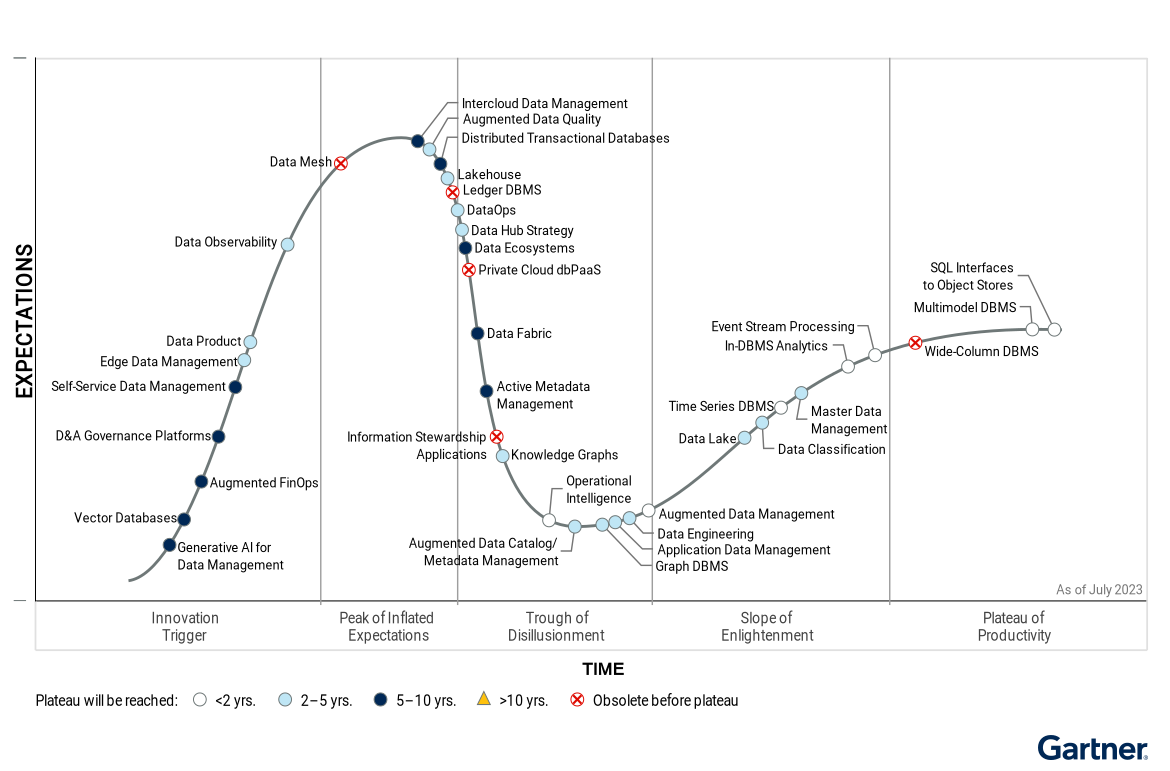
Gartner estimates 25% of data management vendors will provide a complete data fabric solution by 2024 – up from 5% today
Both provide an architectural framework to access data across multiple technologies and platforms.
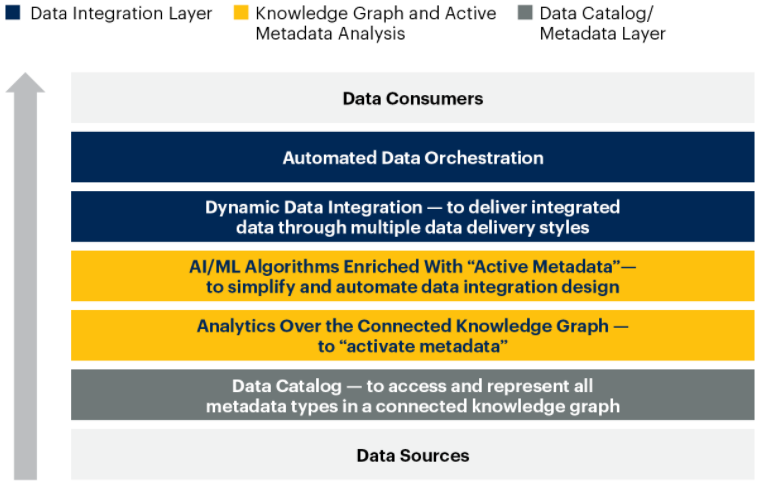
Data fabric
Attempts to centralize and coordinate data management
Tackles the complexity of data and metadata in a smart way that works well together
Focus on the architectural, technical capabilities, and intelligent analysis to produce active metadata supporting a smarter, AI-infused system to orchestrate various data integration styles
Data mesh
Emphasis on decentralization and data domain autonomy
Focuses on organizational change; it is more about people and process
Data are primarily organized around domain owners who create business-focused data products, which can be aggregated and consumed across distributed consumers
Data Fabric and Mesh are the results of the data architecture evolution.
Many capabilities were in existence already long before the terms were coined
Takeaway:
Abstract the “building blocks” of such platforms
Let them evolve according to scalability and flexibility requirements
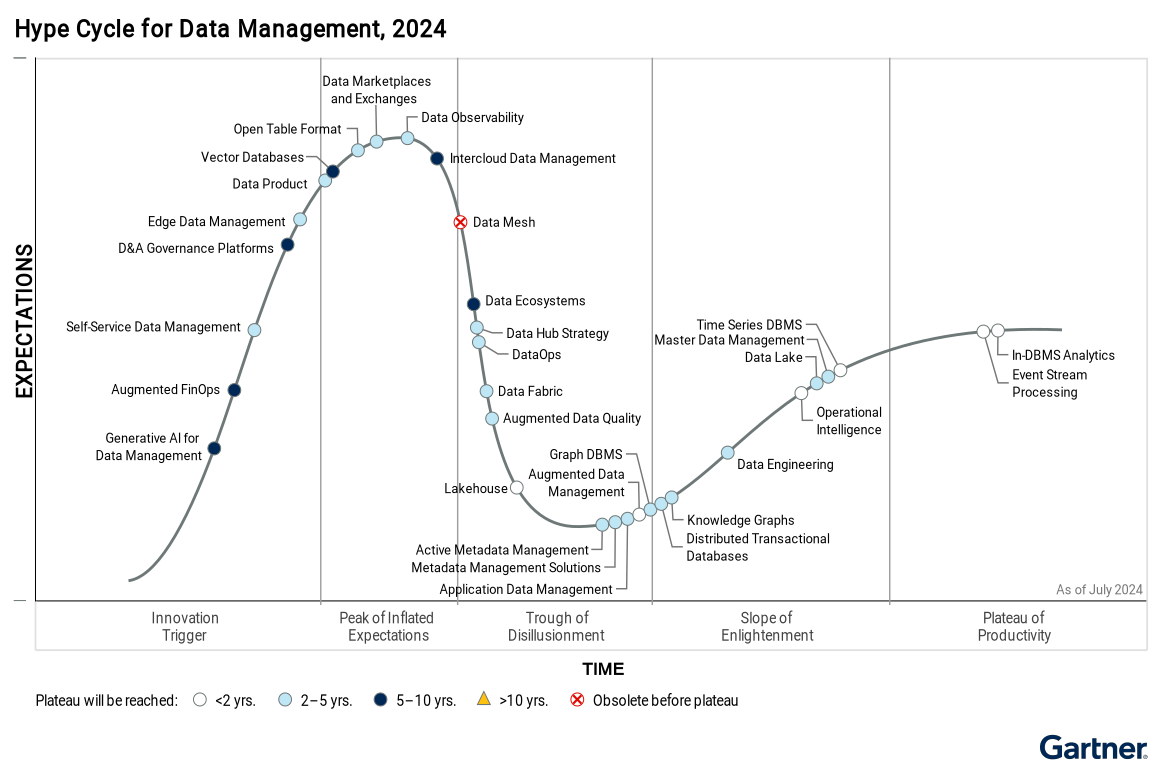
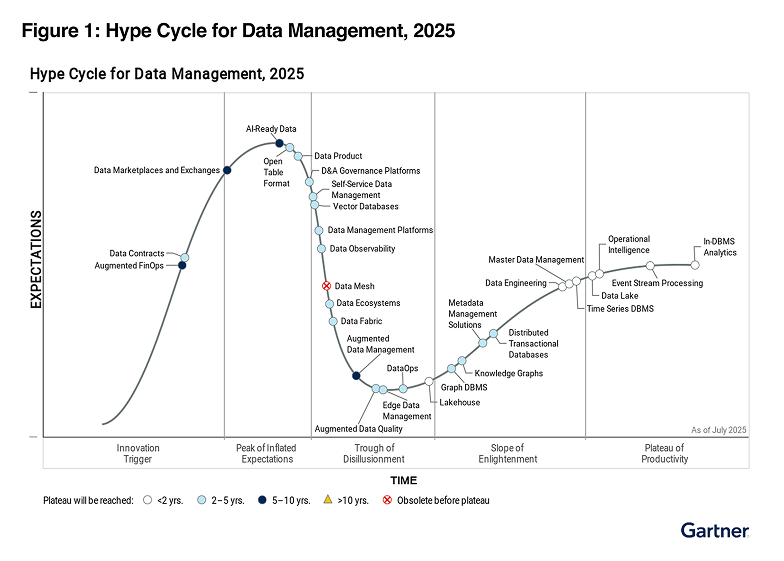
Data mesh
2024
2025
As new technologies and solutions mature to support a centralized approach to data access, distributed approaches like Data Mesh are expected to fall increasingly out of favor in enterprise IT.
Data mesh
2023
2024
As new technologies and solutions mature to support a centralized approach to data access, distributed approaches like Data Mesh are expected to fall increasingly out of favor in enterprise IT.
Wooclap (examples of exam questions)
(Some) References
Ref 1
Ref 2
Ref 3
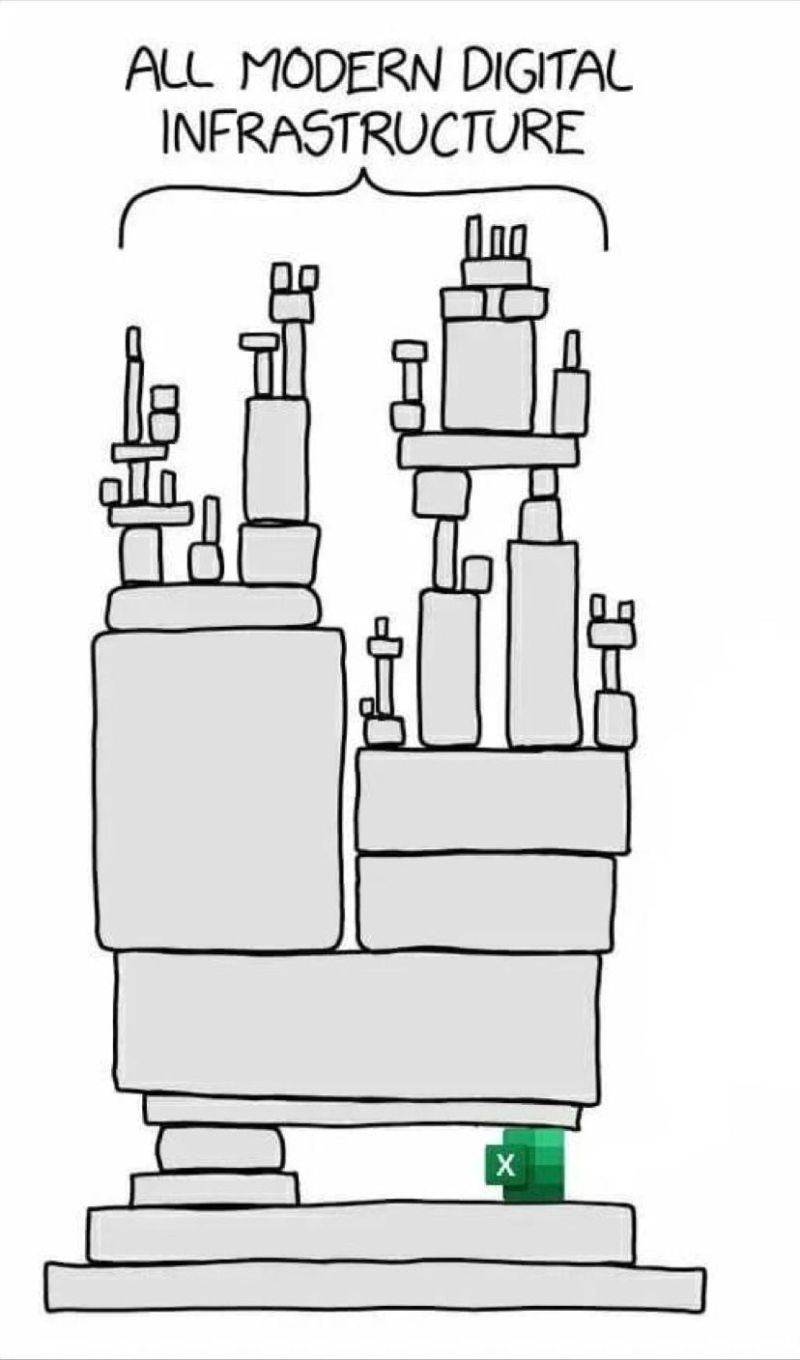
Example of data platform: Hadoop-based
A data platform on the Hadoop stack requires several tools.
Hadoop-based data platform
How many levels of complexity are hidden here?
How do you provision it?
Manual provisioning on-premises
Semi-automatic provisioning on-premises
Automatic provisioning in the cloud
“Example” of architecture
https://xkcd.com/2347/
(*) “Ormai sta xkcd é una base troppo usata” A. Tappi
On-premises manual provisioning
It is hardly advisable, if not for small and local tests.
Technical challenges
Installation: how do I set up a new machine?
Networking: how do I cable dozens of machines?
Management: how do I replace a broken disk?
Upgrade: how do I extend the cluster with new services/machines?
(energy and cooling, software licenses, insurance…)
Technological challenges
How do we configure a distributed environment?
How do we set up/integrate/control independent services?
How do we orchestrate data flows?
Business challenges
Can we afford to spend resources on tasks that are not mission-oriented?
No free lunch, each choice has a cost/benefit
How much time does it take to master a technology?
How many people do I need?
Data platform: related job positions
(Big) data pipeline
Data platform: related job positions
Data platform engineer
Orchestrate the successful implementation of cloud technologies within the data infrastructure of their business
Solid understanding of impact database types and implementation
Responsible for purchasing decisions for cloud services and approval of data architectures
Data architect
Team members who understand all aspects of a data platform’s architecture
Work closely with the data platform engineers to create data workflows
Data scientist
Analyze and interpret complex digital data
Work with new technologies (e.g., machine learning) to deepen the business’s understanding and gain new insights
Data analyst
Analyze data systems, creating automated systems for retrieving data from the data platform
Cloud data analysts are more commonly members of the business user population
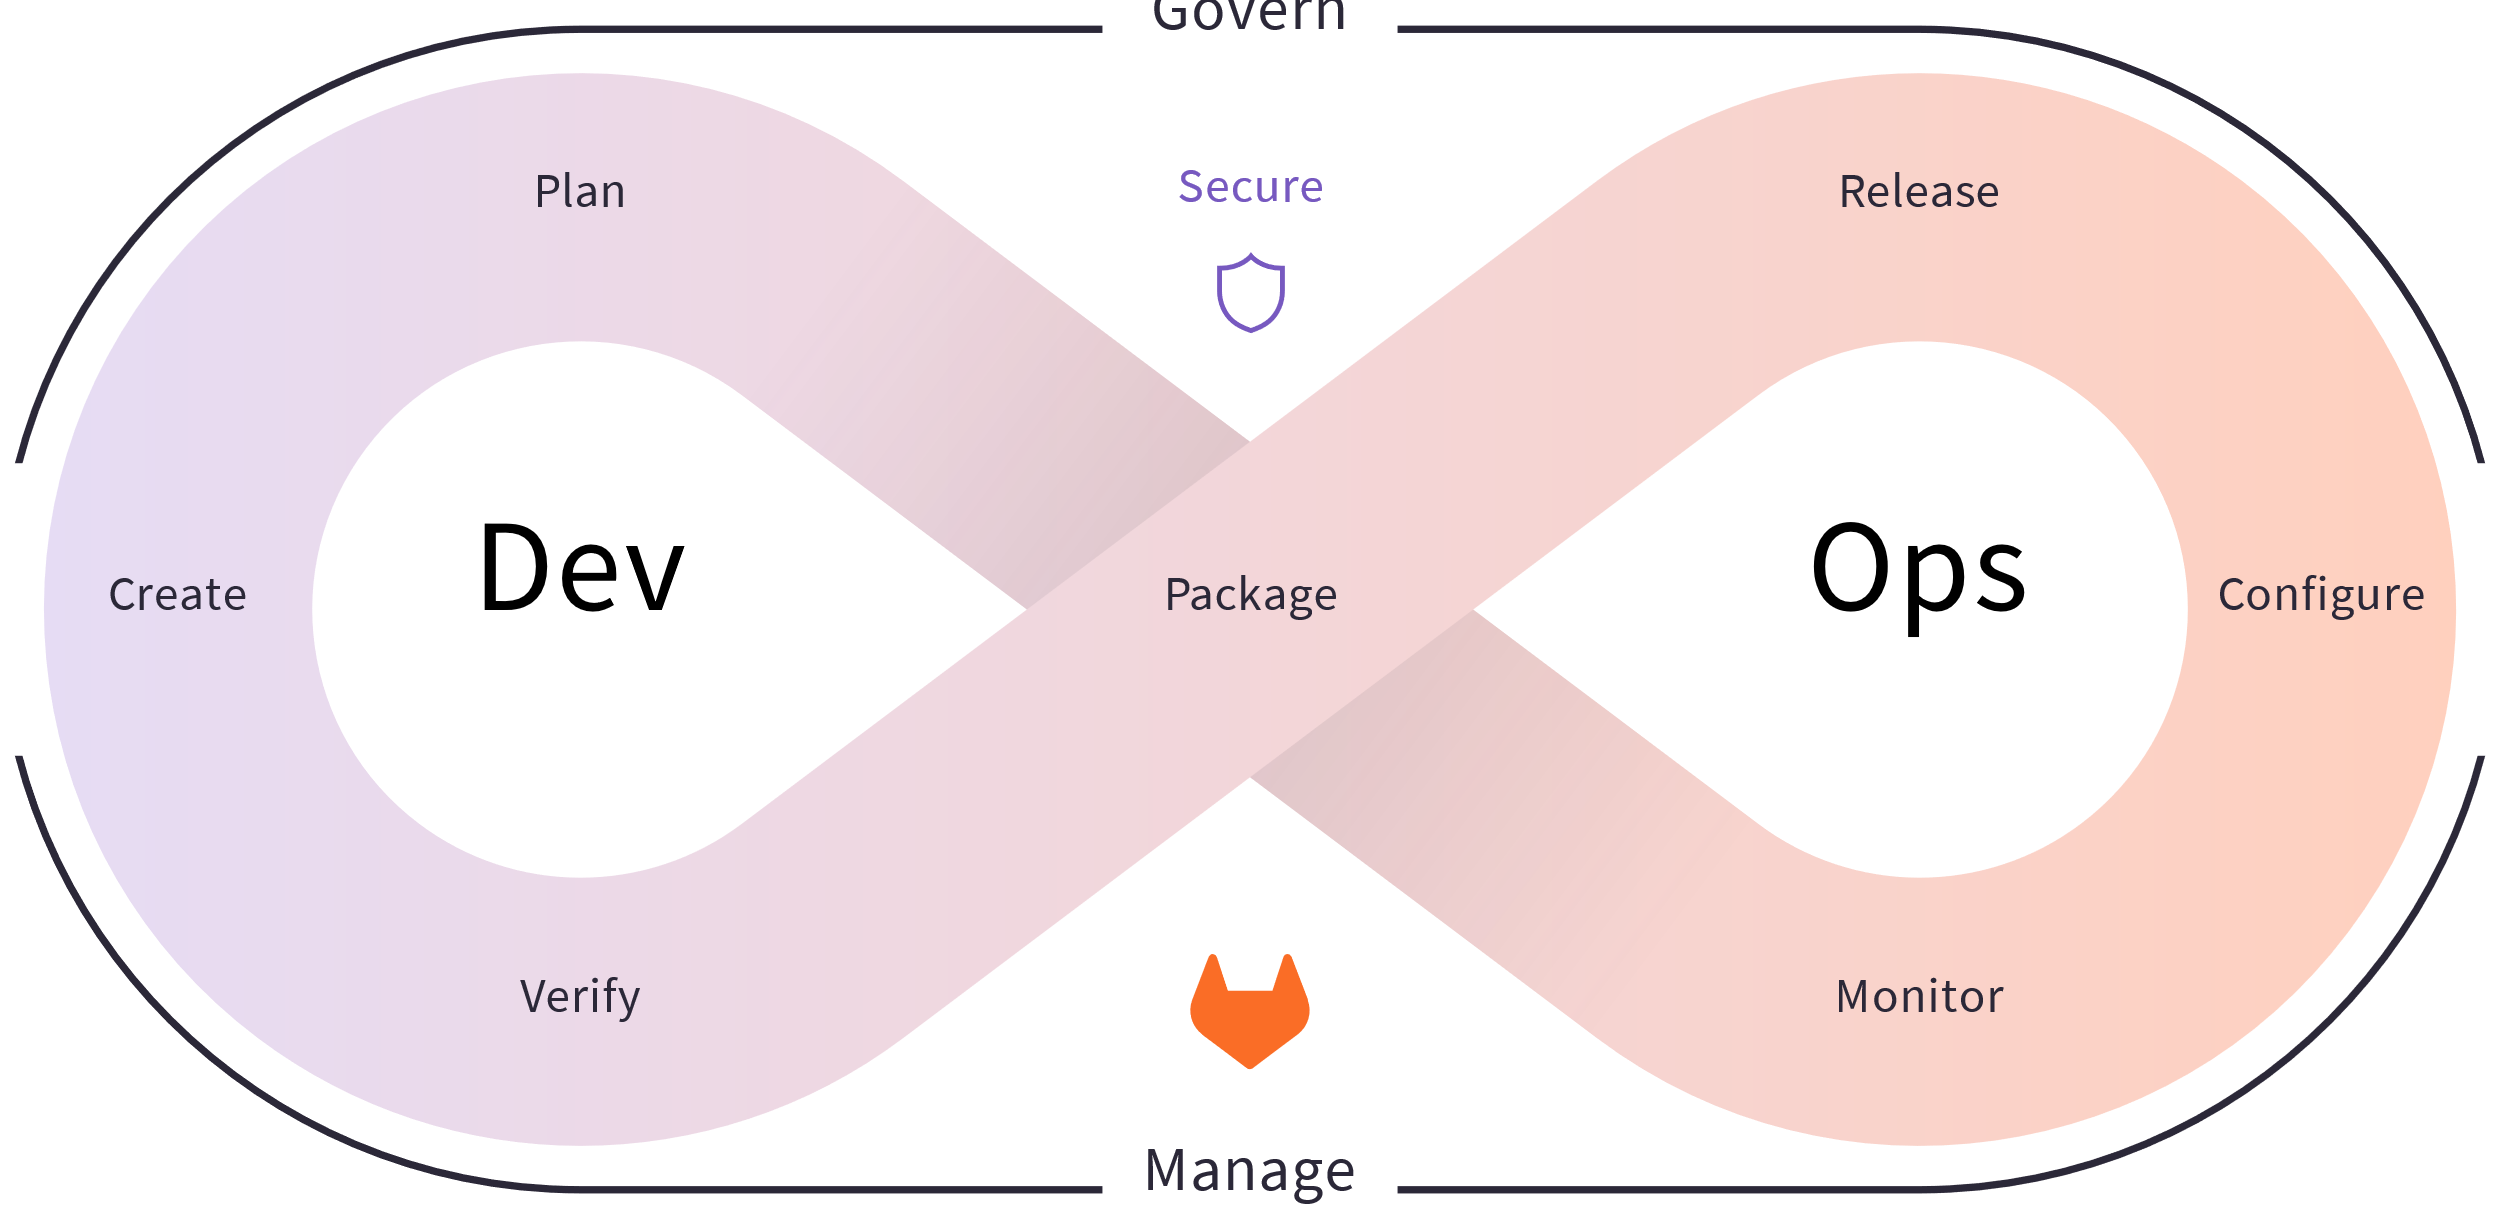
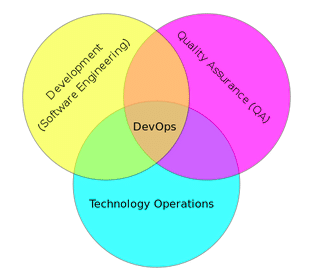
From DevOps…
DevOps combines development and operations to increase the efficiency, speed, and security of software development and delivery compared to traditional processes.
DevOps practices enable software development (dev) and operations (ops) teams to accelerate delivery through automation, collaboration, fast feedback, and iterative improvement.
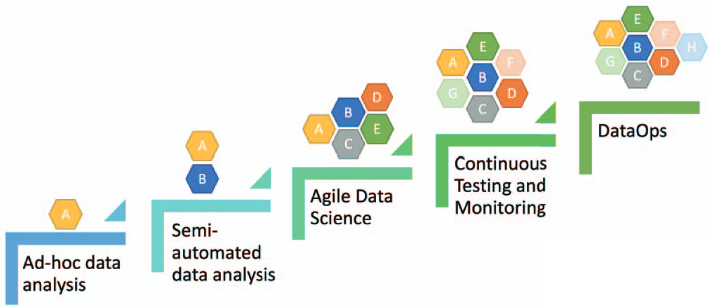
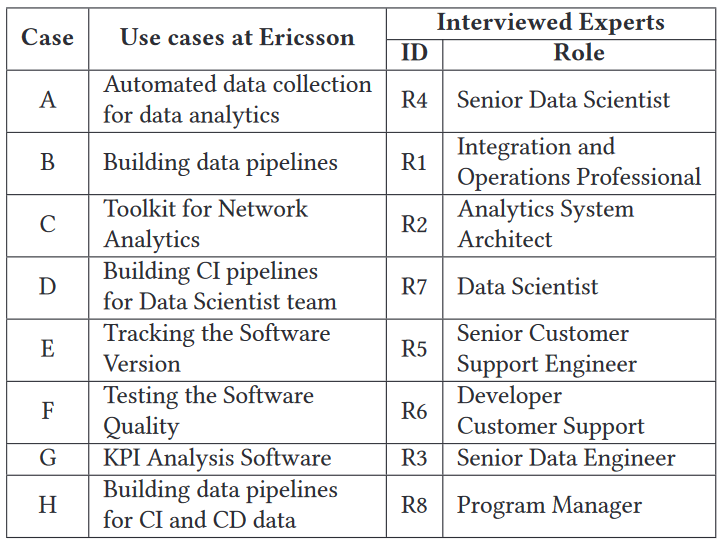
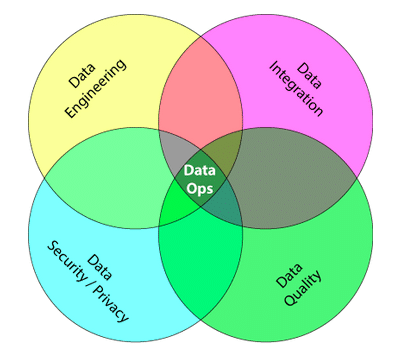
DataOps refers to a general process aimed at shortening the end-to-end data analytics life-cycle time by introducing automation in the data collection, validation, and verification process
“A collaborative data management practice focused on improving the communication, integration and automation of data flows between data managers and data consumers across an organization”
Data analytics improved in terms of velocity, quality, predictability, and scale of software engineering and deployment
Some key rules
Establish progress and performance measurements at every stage
Automate as many stages of the data flow as possible
Storage should be flexible enough to support heterogeneous data models and raw data.
From operational databases to DWHs (why?)
From relational data models to NoSQL (why?)
Data lake to (directly) ingest raw data
Storage, per se, is insufficient to get value from the data (examples?)
We also need data processing and fruition
Data lakes are blurring into data platforms
Data platforms support end-to-end data needs (which ones?)
Building data platforms is hard (why?)
Managing data platforms is hard; exploit metadata to ease this task
Data lineage, compression, profiling, resolution, etc.
Open question: How do we deploy working data platforms?
How do I know if I am prepared for the exam?
Open a random slide, are you able to explain its content and connect it to the rest of the topics?
References
Ahmed, Mohiuddin. 2019. “Data Summarization: A Survey.”Knowledge and Information Systems 58 (2): 249–73.
Armbrust, Michael, Ali Ghodsi, Reynold Xin, and Matei Zaharia. 2021. “Lakehouse: A New Generation of Open Platforms That Unify Data Warehousing and Advanced Analytics.” In Proceedings of CIDR, 8:28.
Barika, Mutaz, Saurabh Garg, Albert Y Zomaya, Lizhe Wang, Aad Van Moorsel, and Rajiv Ranjan. 2019. “Orchestrating Big Data Analysis Workflows in the Cloud: Research Challenges, Survey, and Future Directions.”ACM Computing Surveys (CSUR) 52 (5): 1–41.
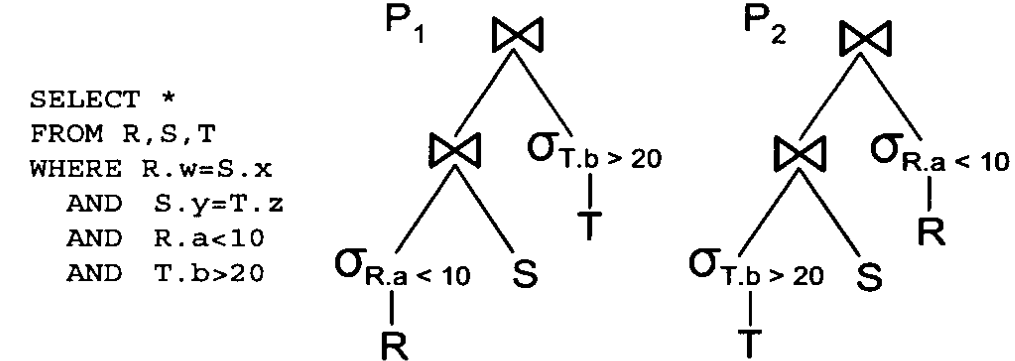
Bruno, Nicolas, and Surajit Chaudhuri. 2002. “Exploiting Statistics on Query Expressions for Optimization.” In Proceedings of the 2002 ACM SIGMOD International Conference on Management of Data, 263–74.
Burkhard, Walter A., and Robert M. Keller. 1973. “Some Approaches to Best-Match File Searching.”Communications of the ACM 16 (4): 230–36.
Couto, Julia, Olimar Teixeira Borges, Duncan D Ruiz, Sabrina Marczak, and Rafael Prikladnicki. 2019. “A Mapping Study about Data Lakes: An Improved Definition and Possible Architectures.” In SEKE, 453–578.
Forresi, Chiara, Enrico Gallinucci, Matteo Golfarelli, and Hamdi Ben Hamadou. 2021. “A Dataspace-Based Framework for OLAP Analyses in a High-Variety Multistore.”The VLDB Journal 30 (6): 1017–40. https://doi.org/10.1007/S00778-021-00682-5.
Golfarelli, Matteo, Dario Maio, and Stefano Rizzi. 1998a. “Conceptual Design of Data Warehouses from E/R Schema.” In Thirty-First Annual Hawaii International Conference on System Sciences, Kohala Coast, Hawaii, USA, January 6-9, 1998, 334–43. IEEE Computer Society. https://doi.org/10.1109/HICSS.1998.649228.
———. 1998b. “The Dimensional Fact Model: A Conceptual Model for Data Warehouses.”Int. J. Cooperative Inf. Syst. 7 (2-3): 215–47. https://doi.org/10.1142/S0218843098000118.
Golfarelli, Matteo, and Stefano Rizzi. 2009. Data Warehouse Design: Modern Principles and Methodologies. McGraw-Hill, Inc.
Herschel, Melanie, Ralf Diestelkämper, and Houssem Ben Lahmar. 2017. “A Survey on Provenance: What for? What Form? What From?”The VLDB Journal 26 (6): 881–906.
Ikeda, Robert, and Jennifer Widom. 2009. “Data Lineage: A Survey.” Stanford InfoLab.
Lcvenshtcin, VI. 1966. “Binary Coors Capable or ‘Correcting Deletions, Insertions, and Reversals.” In Soviet Physics-Doklady. Vol. 10. 8.
Mann, Bob. 2002. “Some Data Derivation and Provenance Issues in Astronomy.” In Workshop on Data Derivation and Provenance, Chicago.
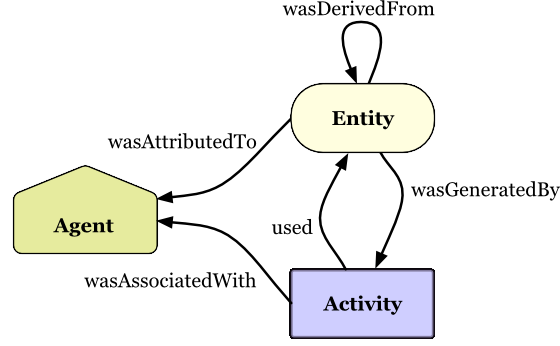
Moreau, Luc, and Paul Groth. 2022. Provenance: An Introduction to PROV. Springer Nature.
Munappy, Aiswarya Raj, David Issa Mattos, Jan Bosch, Helena Holmström Olsson, and Anas Dakkak. 2020. “From Ad-Hoc Data Analytics to Dataops.” In Proceedings of the International Conference on Software and System Processes, 165–74.
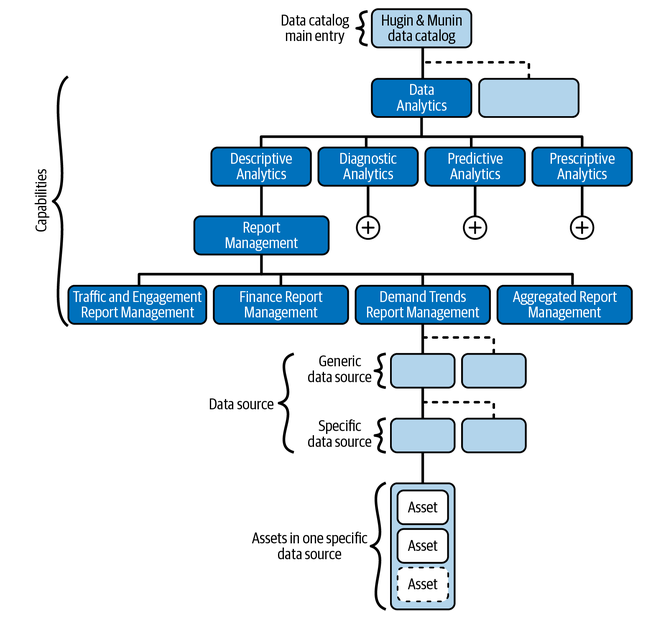
Olesen-Bagneux, Ole. 2023. The Enterprise Data Catalog. "O’Reilly Media, Inc.".
Özsu, M. Tamer. 2018. “Database.” In Encyclopedia of Database Systems, edited by Ling Liu and M. Tamer Özsu, 931–32. New York, NY: Springer New York. https://doi.org/10.1007/978-1-4614-8265-9_80734.
Papadakis, George, Dimitrios Skoutas, Emmanouil Thanos, and Themis Palpanas. 2020. “Blocking and Filtering Techniques for Entity Resolution: A Survey.”ACM Computing Surveys (CSUR) 53 (2): 1–42.
Simmhan, Yogesh L, Beth Plale, Dennis Gannon, et al. 2005. “A Survey of Data Provenance Techniques.”Computer Science Department, Indiana University, Bloomington IN 47405: 69.
 Case study: photo gallery